This morning as the market opened, I was watching CNBC and scrolling through market headlines on my phone as I usually do, trying to get a sense for what the day’s drivers might be.
A couple of headlines caught my attention because they were effective at using attention-grabbing words; if you’re a little attention deficit-oriented as I am, provocative language is a good way to make me stop what I’m doing and check you out.
Today’s provocative phrase of the moment was “death cross,” and the headlines I was catching seemed to be using it as a way to predict the beginning of the end of the market as we know it. I opened a couple of the articles and started reading, and then I chuckled. As a writer, I have an appreciation for people who can use language effectively; but I’m also aware that language is often used to manipulate emotions and provoke reactions that may not actually be entirely justified.
It’s one of the reasons I don’t like listening to political talk shows or commentary, of just about any type, from either end of the political spectrum; they almost always seem to operate with the same agenda, which is to use language to incite fear and anger about the concepts and politics they don’t agree with.
The “death cross” caught my attention, not because it’s a new idea, but because it took a well-known principle of technical analysis – using trends over contrasting periods of time to identify potential turning points in the market – and gave it a catchy, terrifying name.
The pattern is corresponds to, specifically is a cross of an asset’s short-term trend line below its long-term trend line. The easiest way to see it is using moving averages. The reason I didn’t catch onto that fact immediately is because the technical term most traders use is simply “moving average crossover,” without any particular innuendo behind it. If you want to refer to a bearish pattern, you usually just call it a “bearish crossover,” and if it’s a bullish pattern, it’s “bullish crossover.”
None of that is very provocative or attention-grabbing, however, and when the market has already been placed on edge over the last month, leaving a lot of investors to wonder if the end of the longest bull run in documented history is finally here, it seems clear that these writers wanted to play on investor fears to generate views and clicks on their articles.
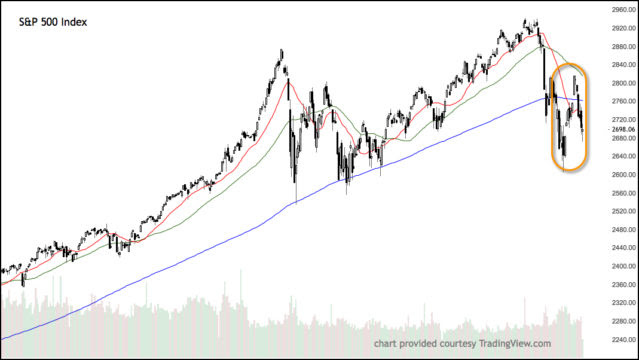
Here’s a chart of the S&P 500’s activity, with moving averages for short, intermediate, and long-term trends superimposed over the daily candlesticks so you can see what the ominous “death cross” really looks like.
-
- Short-term trend: 20-day MA (red)
- Intermediate-term trend: 50-day MA (green)
- Long-term trend: 200-day MA (blue)
The death cross is easy to see; all you have to do is look for the 20-day moving average to cross below the 200-day moving average. That happened on Halloween, just as the S&P 500 was hitting its lowest point since this spring. Moving average crossovers are technical signals that a lot of swing, momentum and trend-based traders like to use to identify buying and selling signals, and so if you’re following any of those kinds of methods, this is absolutely a strong signal to close a long position when it appears.
That is the core principle behind the “death cross” articles I found this morning.
A moving average crossover of a short-term trend below its long-term counterpart is significant, simply because it doesn’t happen often, which is why they are absolutely worth paying attention to when you see them. That said, I also think the term “death cross” is quite over-dramatic, and clearly intended to incite fear that isn’t always justified.
Why? Because every long-term bullish trend will inevitably experience multiple “death cross” patterns. For the broad market, they generally represent retracements, or corrections of the market’s long-term upward trend. The reason I think you have to be careful about assuming the worst is because the market doesn’t often follow through on the pattern to extend into a legitimate bear market.
I decided to trace the market’s activity back over the last three bull markets to see how often a “death cross” showed up, versus how often it actually triggered an actual long-term trend reversal. Here are the numbers:
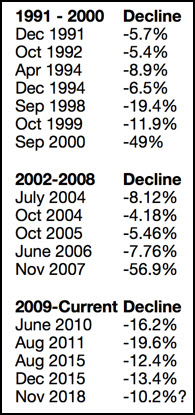
In each of the last three bull markets, including this one, it’s clear to see that the “death cross” pattern doesn’t always lead to a bear market. There are a couple of takeaways to the numbers I’ve listed here that I think are useful.
First, don’t ignore the fact that just because a “death cross” more often than not doesn’t mean a bear market is imminent, the appearance of this bearish crossover pattern at the late stages of an extended bull market is a warning sign.
It is interesting to me that that in 1998, the market came very close to dropping enough to be considered a bear market move, but pushed back to new highs and kept going for the next two years until the end of the dot-com boom in September of 2000.
Another interesting point is the size of the corrections the market has seen during this latest bull run when the bearish crossover pattern has appeared. The larger average size of those declines versus the two prior bull markets to me is an indication of the increased level of volatility investors have been working with for the last decade.
In that context, this latest correction is the smallest of the entire bunch so far, which to me still means that we are a long ways away from calling for an imminent bear market. Is risk elevated right now? You bet it is, and the size of the bear market drops that came from 2000 to 2002, and 2007 to 2009 are an important reminder that the longer the bull market lasts, the more seriously you should consider the risk you must be willing to accept when you take on a new position.
At the same time, don’t let the alarmists and fear-mongers put you too much on edge. There are some very nice opportunities that the market’s drop to this point has uncovered, with more and more showing up every day. If you focus on value and fundamental strength, and apply smart and conservative rules to often you place a new trade and how much money you commit to a new position, you can keep your money working for you.