While the market in the United States was closed for the President’s Day holiday, Asia and Europe were open, and seemingly positive news on the trade front between the United States and China gave those markets reason to bounce higher. Investors have been anxious over the last couple of weeks to price the expectation of a trade agreement ahead of a Trump-imposed March 1 deadline into stock prices; that has given the broad market some buoyancy, and helped companies in industries most directly impacted by trade rally higher. Stocks in the auto industry have been among the beneficiaries, since trade peace between the U.S. and China should logically help with America’s other trading partners, including Europe, Canada and Mexico.
Harley-Davidson Inc. (HOG) isn’t an auto company, of course; but they are categorized in the same market space as auto stocks. This is a stock that has been in a downward trend that has now extended over a little more than two years, and that most analysts have continued to maintain bearish forecasts with. As of Friday’s close, the stock’s decline from a January 2017 high around $64 marked a drop of more than 41%.
HOG is a company with an interesting fundamental profile; there are a number of elements that indicate strength, including a larger-than-normal dividend yield, good liquidity and strong Free Cash Flow. The stock’s downward trend has separated the stock from others in its industry, but not necessarily in positive ways. The company itself has acknowledged a shift in consumer trends away from motorcycles (including the kind of heavy bikes the company is known for), most particularly in the United States. Their revenues, and profits have been declining for almost all of the past two years, and experts seem mixed at best at the prospects the company will be able to reverse that trend anytime soon. Given that fact, the stock’s decline over the last two years could mark a big bargain price – or a big value trap. So which is it?
Fundamental and Value Profile
Harley-Davidson, Inc. is the parent company for the groups of companies doing business as Harley-Davidson Motor Company (HDMC) and Harley-Davidson Financial Services (HDFS). The Company operates in two segments: the Motorcycles & Related Products (Motorcycles) and the Financial Services. The Motorcycles segment consists of HDMC, which designs, manufactures and sells at wholesale on-road Harley-Davidson motorcycles, as well as motorcycle parts, accessories, general merchandise and related services. The Company manufactures and sells at wholesale cruiser and touring motorcycles. The Financial Services segment consists of HDFS, which provides wholesale and retail financing and insurance-related programs to the Harley-Davidson dealers and their retail customers. HDFS is engaged in the business of financing and servicing wholesale inventory receivables and retail consumer loans for the purchase of Harley-Davidson motorcycles. HOG has a current market cap of $6.1 billion.
Earnings and Sales Growth: Over the last twelve months, earnings declined -68.5%, while sales decreased almost -7%. Over the last quarter, the drop in earnings was about -78%, with sales declining nearly -13%. HOG also shows a significantly deteriorating margin profile, with Net Income that declined from a very healthy 10.7% over the last twelve months to a scant 0.05% in the last quarter.
Free Cash Flow: HOG’s Free Cash Flow is healthy at more than $922 million. That translates to an impressive Free Cash Flow Yield of a little more than 16%.
Debt to Equity: HOG is among the most highly leveraged companies in its industry; it has a debt/equity ratio of 2.76. Even with their high debt load and a declining margin profile, they retain more than adequate financial ability to service their debt. In this last quarter, total cash and liquid assets were more than $1.25 billion, while long-term debt is a little less than $5 billion.
Dividend: HOG pays an annual dividend of $1.48 per share. At the stock’s current price, that translates to a dividend yield of 3.97%.
Price/Book Ratio: there are a lot of ways to measure how much a stock should be worth; but one of the simplest methods that I like uses the stock’s Book Value, which for HOG is $10.87per share. Book Value dropped more than $1 per share in the last quarter, and at the stock’s current price, that translates to a Price/Book Ratio of 3.43. The historical average for HOG is 4.13. A move to par with its historical average would put HOG about 20% above its current price at about $45 per share.
Technical Profile
Here’s a look at the stock’s latest technical chart.
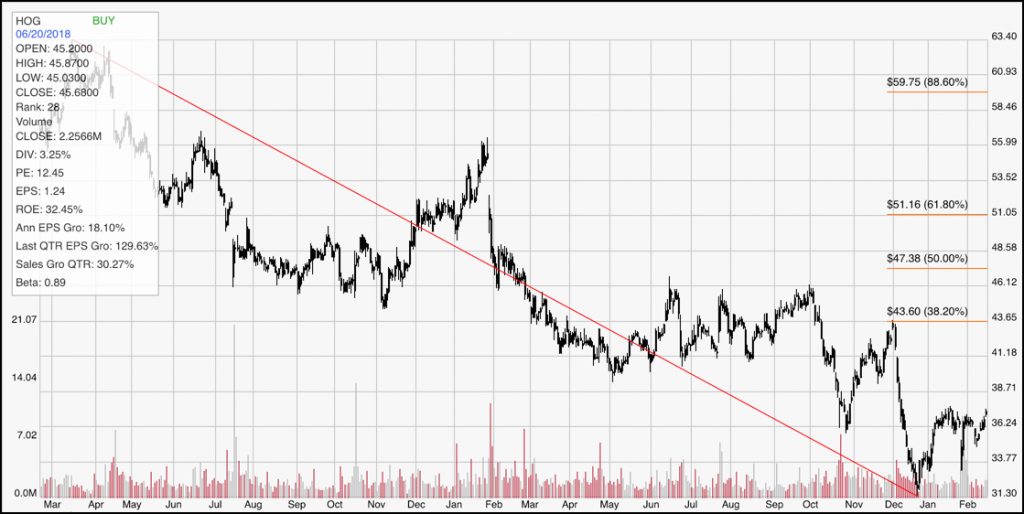
Current Price Action/Trends and Pivots: The red diagonal line traces the stock’s decline from its two-year high at nearly $64 per share to its downward trend low at around $31. It also provides the baseline for the Fibonacci retracement lines on the right side of the chart. Like the rest of the industry, the stock has shown some nice momentum on the bullish side since the beginning of the year, having rallied almost 10% off of its low point. Immediate resistance is at around $43 per share. The stock’s current level should put support at around $36, while a break down below that level could mark a retest of the trend low at around $31.
Near-term Keys: The stock’s current bullish momentum could provide some upside potential to around $43 if you’re willing to take a very aggressive approach using call options or to buy the stock itself. Be careful, though; a drop below $36 could offer a much higher-probability trade by shorting the stock or working with put options. What of the value proposition? The truth is that the stock’s multi-year pattern of declining revenues is a very troubling sign, and the stock’s deteriorating Net Income compounds the risk even further. The stock’s bargain price could be compelling, but not until the company can demonstrate marked improvement in those areas.