The market has been rallying nicely since the end of December, and the news lately seems to be giving investors encouragement to start thinking in more bullish terms. The Fed seems to be positioning itself to be more dovish in its approach to interest rates through the year, trade talks between the United States and China continue, with mostly positive signs a compromise can be reached, and the U.S. economy continues to be strong and healthy.
A lot of industries have been rallying this year; but one of the stocks that has unquestioningly been leading the market is Intuit Inc (INTU). The stock followed the rest of market from a high around $230 in early October to a low point around $182 at the end of the year, but has surged more than 27% from that point to reach a new all-time high as of Friday’s close. The maker of TurboTax and QuickBooks also has seasonality working in its favor, as workers throughout the country prepare and file their taxes before the annual April 14 deadline. That means lots of users, existing and new, on both the consumer and small business sides of things.
While most bullish investors will look at a stock making new all-time highs as a positive indication that the stock should keep moving higher, value investors tend to take a more jaded view. Value investing is a bit contrarian, which means that the natural reaction to a stock at new all-time highs is to start looking for signs that the run is over. It follows one of the basic tenets of trend analysis, which is that the beginning of a new bearish trend is always at the end, or top of a bullish trend. It’s also a primary reason that value-oriented investing focuses on stocks that are usually at or near historical lows.
In the value-based context I’ve just described, INTU is an example of a stock that I usually pass over. The company has a mostly solid fundamental profile, though, with a balance sheet that shows excellent financial flexibility and liquidity. Another interesting element is the fact that the stock could actually be undervalued right now, even with its recent surge and push to a new all-time high. Does that mean there is an opportunity you should pay attention to? Maybe.
Fundamental and Value Profile
Intuit Inc. is a provider of business and financial management solutions for small businesses, consumers and accounting professionals. The Company operates through three segments: Small Business, Consumer Tax and ProConnect. The Small Business segment serves and advises small businesses and the accounting professionals, and includes QuickBooks financial and business management online services and desktop software, payroll solutions, and payment processing solutions. The Small Business segment also includes third-party applications that integrate with the Company’s offerings. The Consumer Tax segment targets consumers and includes TurboTax products and services, which enable individuals to prepare and file their own federal and state personal income tax returns. The ProConnect segment targets professional accountants in the United States and Canada. Its ProConnect professional tax offerings include Lacerte, ProSeries, ProFile and ProConnect Tax Online. INTU’s current market cap is $60.9 billion.
Earnings and Sales Growth: Over the last twelve months, earnings increased nearly 78.5%, while revenues increased almost 15%. In the last quarter, however earnings declined -175% while sales increased about 2.8%. The company operates with a margin profile that was very impressive in over the last twelve months; Net Income during that period was more than 20% of Revenues. The picture narrowed dramatically in the last quarter, at only 3.33% of Revenues.
Free Cash Flow: INTU’s free cash flow is more than $1.9 billion, which is pretty healthy, but translates to a minimal Free Cash Flow Yield of 3.2%.
Dividend Yield: INTU’s dividend is $1.88 per share, which translates to an annual yield of about .8% at the stock’s current price.
Debt to Equity: INTU has a debt/equity ratio of .13. This is a very low number that reflects the company’s strong financial footing. Their balance sheet shows more than $1.3 billion in cash and liquid assets in the last quarter against only $375 million of long-term debt.
Price/Book Ratio: there are a lot of ways to measure how much a stock should be worth; but one of the simplest methods that I like uses the stock’s Book Value, which for INTU is $10.72 per share. With the stock at nearly $235 per share, that translates to a Price/Book ratio of 21.88, which is very high compared to the Price/Book levels I usually look for. However, the stock’s historical Price/Book ratio is nearly 27, which puts a long-term target price above $288 per share. That’s a discount of about 20% from that price, which is even more impressive considering the fact the stock has already rallied more than 27% since the beginning of the year.
Technical Profile
Here’s a look at the stock’s latest technical chart.
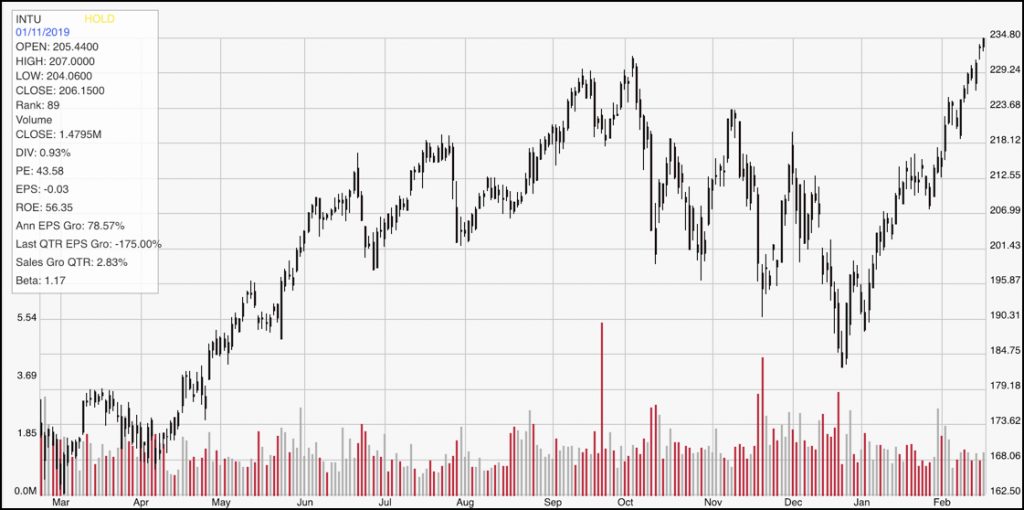
Current Price Action/Trends and Pivots: This chart traces the stock’s movement over the last year. The stock’s upward trend is clear, with the stock recently pushing above its September peak to set a brand new high price. Without a clear new resistance level, it can be hard to determine where the stock’s next peak is likely to be seen; one approach that I think is reasonable when a stock is making a new all-time high is to use a portion of the rally that led to the new high. The midpoint for the stock’s push off of its December low point is around $207, which marks a difference of about $25 per share. Adding that to the stock’s current level provides an intermediate resistance level in the $260 range. Since it has recently broken resistance from its September high around $230, that should now act as support to help stabilize the stock’s last upward trend; however a break below that point would likely see the stock drop back into the $218 area to find new support.
Near-term Keys: If you want to be aggressive on the bullish side, the stock’s break above resistance could be an impressive signal to buy the stock or to work with call options. If you are planning a short-term bullish trade, don’t try to hold out for the stock to reach $260 before you close the trade; look for signs the stock is finding a new resistance level – tapering buying volume, a drop off of the latest high – and don’t be afraid to consider locking in your profits by closing the trade. If the stock drops below $230, the support break should be used as an indication the upward trend may not hold, and that could offer an interest bearish trade by shorting the stock or working with put options with an eye on the $218 level as an exit for that trade.