Economic reports this week set the market on edge this week, although optimism related to trade gave investors reasons to push the market higher late in the week. One of the risks that I’ve seen some experts and economists start talking about more lately is the possibility that if and when a trade deal with China is reached, the market could reverse back lower, because a trade has already been priced into the market. That implies that a smart approach right now could be to start thinking in more defensive terms. In that vein, it has seemed prudent lately to start thinking in more defensive terms. As you’ve probably noticed, one of my favorite areas to pay attention to in these conditions comes from stocks in the Consumer Staples sector. A lot of the stock in this sector are useful as tools to moderate broad market downside risk.
I like to use this sector as a “defensive” source for investing opportunities because no matter what kind of economic conditions we’re in, stocks that fit this category tend to perform pretty well. They make products, or provide services that consumers need all the time. Food stocks, including producers, processors, and distributors fit very nicely into this profile.
Kellogg Company (K) is another leading company in the Food Products industry of the Consumer Staples sector. Like General Mills Inc. (GIS), it’s a stock that has followed a long-term downward trend that dates all the way back to July of 2016. The market has beat the stock down from a multi-year high around $87 per share to a current level around $57 per share. The stock has been affected by many of the same broader trends as K, including declining revenues and shifting consumer preferences away from traditional food product brands. The company does have some interesting fundamental signs of strength, and based on simply valuation analysis looks quite attractive at its current price level; but there are other fundamental signs that imply the stock’s downside risk could continue to remain very high, which means that you should think very carefully before taking on any kind of long-term position right now.
Fundamental and Value Profile
Kellogg Company is a manufacturer and marketer of ready-to-eat cereal and convenience foods. The Company’s principal products are ready-to-eat cereals and convenience foods, such as cookies, crackers, savory snacks, toaster pastries, cereal bars, fruit-flavored snacks, frozen waffles and veggie foods. Its segments include U.S. Morning Foods, which includes cereal, toaster pastries, health and wellness bars, and beverages; U.S. Snacks, which includes cookies, crackers, cereal bars, savory snacks and fruit-flavored snacks; U.S. Specialty, which represents food away from home channels, including food service, convenience, vending, Girl Scouts and food manufacturing; North America Other, which includes the U.S. Frozen, Kashi and Canada operating segments; Europe, which consists of European countries; Latin America, which consists of Central and South America and includes Mexico, and Asia Pacific, which consists of Sub-Saharan Africa, Australia and other Asian and Pacific markets. K’s current market cap is $19.7 billion.
Earnings and Sales Growth: Over the last twelve months, earnings declined about -5.2%, while revenues were modestly higher, at 3.3%. In the last quarter, the decline in earnings accelerated to -14% while sales dropped about -4.3%. The company operates with a margin profile that appears to be deteriorating; over the last twelve months, Net Income during that period was 9.86% of Revenues, but narrowed in the last quarter, to -2.5% of Revenues.
Free Cash Flow: K’s free cash flow is about $950 million and translates to a Free Cash Flow Yield of 4.86%.
Dividend Yield: K’s dividend is $2.24 per share, which translates to an annual yield of about 3.94% at the stock’s current price.
Debt to Equity: K has a debt/equity ratio of 2.6. This is a high number, and makes them one of the most heavily leveraged stocks in the Food Products industry. Their balance sheet indicates in the last quarter, cash and liquid assets were $309 million against $8.2 billion in long-term debt. Along with their deteriorating Net Income, liquidity could be an issue in the near term for the company.
Price/Book Ratio: there are a lot of ways to measure how much a stock should be worth; but one of the simplest methods that I like uses the stock’s Book Value, which for K is $9.10 per share. That translates to a Price/Book ratio of 6.23, which is high compared to the Price/Book levels I usually look for. However, the stock’s historical Price/Book ratio is 9.38, which puts a long-term target price around $85 per share and near to its 2016 highs. The stock is also currently trading at a discount of 40% from that price. These are measurements that look very impressive indeed; but given the multiple red flags I outlined in the company’s fundamental profile, I’m skeptical of the stock’s ability to drive anywhere near these highs, even in the long term.
Technical Profile
Here’s a look at the stock’s latest technical chart.
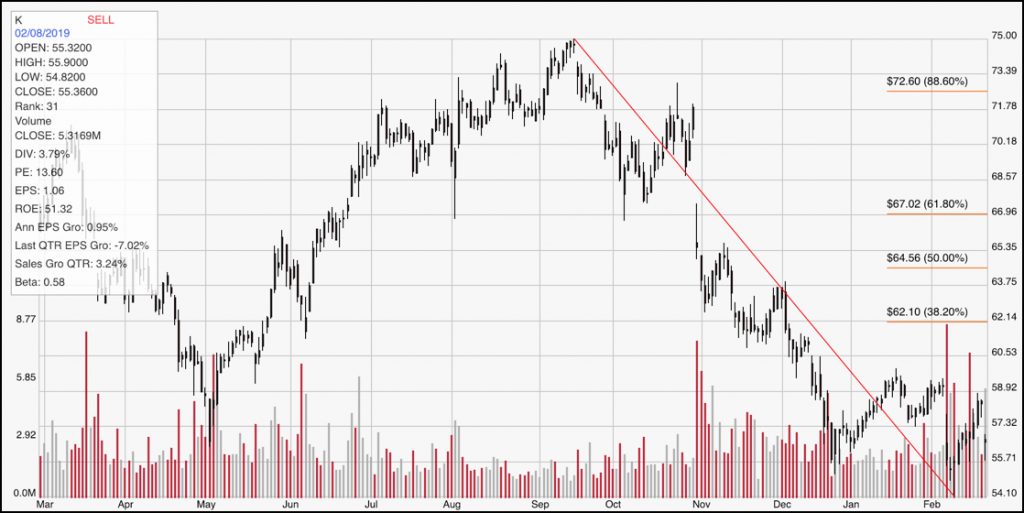
Current Price Action/Trends and Pivots: This chart traces the stock’s movement over the last year. The diagonal red line traces the stock’s downward trend over last five months; it also acts as the baseline for the Fibonacci retracement lines shown on the right side of the chart. The stock’s rally from the bottom of the trend has pushed the stock about 10% above its trend low, and major support at around $55 per share. Immediate resistance is around $59 per share; a break above that point could give the stock room to keep pushing as high as about $62 in the near term, at the resistance shown by the 38.2% retracement line.
Near-term Keys: If you’re looking for a short-term, bullish trade, look for a break above resistance to $59 as a good signal to buy the stock or to work with call options. If the stock shows weakness, and pushes below its major support at $55, consider shorting the stock or working with put options, with an eye on the $49 to $50 level. I’m taking the stock’s value proposition right now as a major value trap, so the best probabilities for any trade right now lie on the short side, working exclusively with short-term timeframes.