The market started this week strong, spurred by optimism from data that indicated both the Chinese and U.S. economies aren’t slowing as much as previously feared. Reports of positive progress on the trade front helped as well, and could give the market a catalyst to rally and push above its March highs. If the news is as good as it appears, that should help stocks in practically every sector of the market. Trade peace, in particular could be a positive for stocks in the industrial sector, which have followed the market’s lead so far this year to rebound strongly.
One of the most interesting stocks in the Industrial Machinery industry for the last few months, in my opinion, has been OshKosh Truck Corporation (OSK), which despite the fact that the company has been around for decades remains a mid-level player in the industry. That means that the stock doesn’t really draw the same kind of attention that is associated with bigger names like Caterpillar Inc. (CAT) and Deere & Company (DE). Even so, the stock is up more than 25% so far this year, and nearly 50% from its multiyear low reached in April. That movement actually leads most of the stocks in the industry, including OSK’s bigger competitors. It’s a stock with a solid fundamental profile – but has the stock already moved past the point that translates to a good bargain for a long-term investor? I don’t think so. Check it out and see if you agree.
Fundamental and Value Profile
Oshkosh Corporation (OSK) is a designer, manufacturer and marketer of a range of specialty vehicles and vehicle bodies, including access equipment, defense trucks and trailers, fire and emergency vehicles, concrete mixers and refuse collection vehicles. The Company’s segments include Access Equipment; Defense; Fire & Emergency, and Commercial. The Access Equipment segment consists of the operations of JLG Industries, Inc. (JLG) and JerrDan Corporation (JerrDan). The Defense segment consists of the operations of Oshkosh Defense, LLC (Oshkosh Defense). The Fire & Emergency segment consists of the operations of Pierce Manufacturing Inc. (Pierce), Oshkosh Airport Products, LLC (Airport Products) and Kewaunee Fabrications LLC (Kewaunee). The Commercial segment includes the operations of Concrete Equipment Company, Inc. (CON-E-CO), London Machinery Inc. (London), Iowa Mold Tooling Co., Inc. (IMT) and Oshkosh Commercial Products, LLC (Oshkosh Commercial). OSK has a current market cap of about $5.4 billion.
Earnings and Sales Growth: Over the last twelve months, earnings grew by nearly 92%, while revenue increased about 13.5%. Growing earnings faster than sales is difficult to do, and is generally not sustainable in the long-term; but it is also a positive mark of management’s ability to maximize its business operations effectively. The company operates with a stable operating margin; over the last twelve months, Net Income was about 6.62% of Revenues. This number decreased somewhat in the last quarter to a little above 6%.
Free Cash Flow: OSK’s free cash flow is adequate, at about $233 million. This number has is slightly lower since the middle of last year, from $253 million.
Dividend: OSK’s annual divided is $1.08 per share, which translates to a yield of 1.4% at the stock’s current price. That also marks an increase from $.96 per share, per annum around the middle of last year.
Price/Book Ratio: there are a lot of ways to measure how much a stock should be worth; but one of the simplest methods that I like uses the stock’s Book Value, which for OSK is $34.42 and translates to a Price/Book ratio of 2.23 at the stock’s current price. The stock’s historical average Price/Book ratio is 2.33, meaning that the stock is only about 4.5% below that average. That doesn’t sound like there is much room to grow; but another measurement that I like to use to complement my analysis is the stock’s Price/Cash Flow ratio. In the case of OSK, the stock is trading more than 70% below its historical Price/Cash Flow ratio. That suggests the long-term target price for the stock is well above $100 per share, and above the stock’s 2018 high.
Technical Profile
Here’s a look at the stock’s latest technical chart.
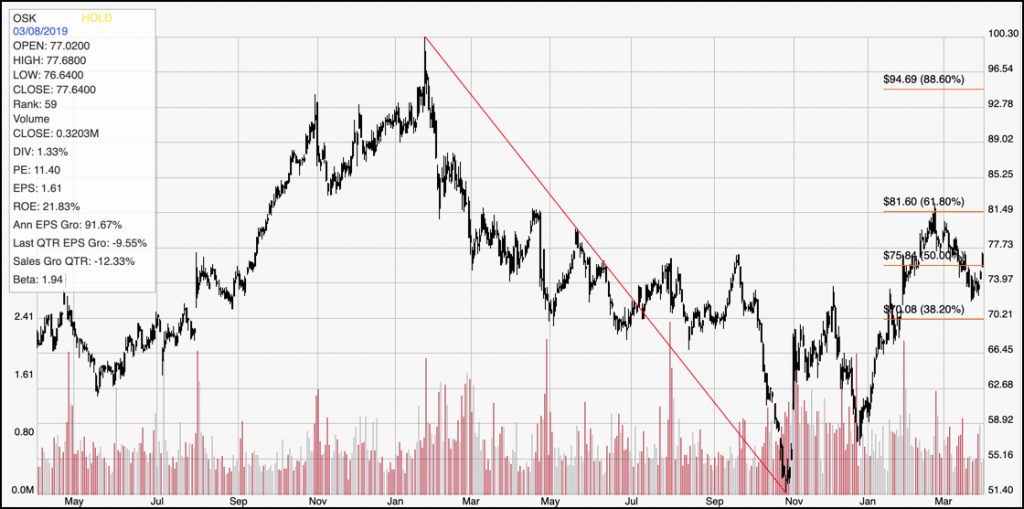
Current Price Action/Trends and Pivots: The red diagonal line measures the length of the stock’s downward trend from $100 a year ago until the beginning of November when it bottomed around $51; it also informs the Fibonacci trend retracement lines shown on the right side of the chart. The stock has rallied nearly 50% from that low point, and in late February the stock actually tested the 61.8% retracement line at around $81.50 per share before retracing to a recent low a bit above the 38.2% retracement line at around $72. The stock appears to be setting up a nice ABC pullback pattern against its short-term upward trend, which usually actually as a nice continuation pattern for a shorter-term trend to extend into a longer period of time.
Near-term Keys: Despite the stock’s rally from its November lows, I believe there is an excellent long-term opportunity to be had, with a long-term target price above $100 per share. If you’re looking for a short-term, momentum-based trade, you could use the stock’s recent pivot low as an aggressive signal to buy the stock or start working with call options with an eye on resistance at around $82. A push below the 38.2% retracement line at $70, on the other hand would mark a break below major support, which could act as a strong signal to short the stock or start working with put options, with a target price around the next most likely support point at around $63 per share.