If you read my highlights in this space on a regular basis, you’ve seen me highlight a number of stocks in the semiconductor industry. It’s an interesting segment of the market to me for a number of different reasons. Over the last decade-plus, it’s been one of the highest-performing pockets of the market, arguably one of the biggest catalysts for the bull run that didn’t see any kind of meaningful lapse or drawdown until 2018. Also, since that time, the industry has been among the most sensitive to geopolitical pressure, especially as it relates to trade.
U.S.-China tensions over fair trade and tariffs have used technology, particularly in the semiconductor industry as a central point of discord. Optimism about negotiations between the two countries sent the industry up in a big way through the first five months of this year, with the Philadelphia Stock Exchange Semiconductor iShares ETF (SOXX) rallying about 50% until the latter part of April. From that point, as accusations have flown and the Trump administration as well as Chinese officials have drawn their own respective “hard lines” in the sand, the industry is back down nearly -18%.
The decline is alarming to those who were making big bets at the top of the trend, but if you’re a contrarian, value-minded investor, that decline could be opening up some big opportunities in some of the best-known names in the sector. I’ve written about many of those stocks in this space already, and as we close out this week, it seemed to make sense to finally take a close look at the 600-lb. gorilla. Intel Corporation (INTC) is the biggest semiconductor company in the world, and as such acts as the standard-setter for everybody else. INTC’s influence isn’t just limited to personal computers, which is what you probably think of first when you hear their name. They are also making big bets in data center processing, graphics and 5G – the areas that most industry experts and CEO’s are predicting will see the greatest growth in the years ahead. The stock is down a little over 25% from its April high and has seen a big surge in bearish momentum as trade tensions have been ramping up. The question, of course is whether the stock is an attractive long-term bet at its current price; let’s take a look.
Fundamental and Value Profile
Intel Corporation is engaged in designing and manufacturing products and technologies, such as the cloud. The Company’s segments are Client Computing Group (CCG), Data Center Group (DCG), Internet of Things Group (IOTG), Non-Volatile Memory Solutions Group (NSG), Intel Security Group (ISecG), Programmable Solutions Group (PSG), All Other and New Technology Group (NTG). It delivers computer, networking and communications platforms to a set of customers, including original equipment manufacturers (OEMs), original design manufacturers (ODMs), cloud and communications service providers, as well as industrial, communications and automotive equipment manufacturers. It offers platforms to integrate various components and technologies, including a microprocessor and chipset, a stand-alone System-on-Chip (SoC), or a multichip package. The CCG operating segment includes platforms that integrates in notebook, two in one systems, desktop computers for consumers and businesses, tablets, and phones. INTC’s current market cap is about $200 billion.
Earnings and Sales Growth: Over the last twelve months, earnings and sales were mostly flat; sales increased about 2.3% while sales decreased by -0.03%. The decline accelerated in the last quarter, which isn’t surprising as existing tariffs have begun to have an impact on corporate earnings, especially on multinational U.S. business. Earning decreased about -30.5%, while sales declined about -14%. Despite the decline, tINTC operates with a very healthy margin profile; Net Income versus Revenues over both the past year was about 27%, and narrowed somewhat in the last quarter to 24.7%. That operating profile gives INTC a lot of flexibility and is a definite source of strength.
Free Cash Flow: INTC’s free cash flow is healthy, at about $12.5 billion and translates to a Free Cash Flow Yield of about 6.04%. The percentage is adequate, but the size of the actual number is a reflection of the company’s operating strength, which should serve it well even if trade tensions continue to linger and cast a near-term, ongoing cloud over the entire industry.
Debt to Equity: INTC has a debt/equity ratio of .35. This is a conservative number. The company’s balance sheet indicates that operating profits are adequate to service their debt, with $12 billion in cash and liquid assets versus $25.7 billion in long-term debt. They have a lot of debt, but with a healthy operating margin profile and sizable cash position, servicing their debt shouldn’t be a problem.
Dividend: INTC pays an annual dividend of $1.26 per share, which translates to an attractive yield of 2.81%.
Price/Book Ratio: there are a lot of ways to measure how much a stock should be worth; but one of the simplest methods that I like uses the stock’s Book Value, which for INTC is $15.74, and which translates to a Price/Book ratio of 2.84 at the stock’s current price. Their historical average Price/Book ratio is 2.88, which means that on this basis alone, the stock is fairly valued, with a useful discount not really being seen until about the $36 price level. The stock’s Price/Cash Flow ratio is more interesting, since that is currently trading 30% below its historical average and provides a long-term target at around $58 per share.
Technical Profile
Here’s a look at the stock’s latest technical chart.
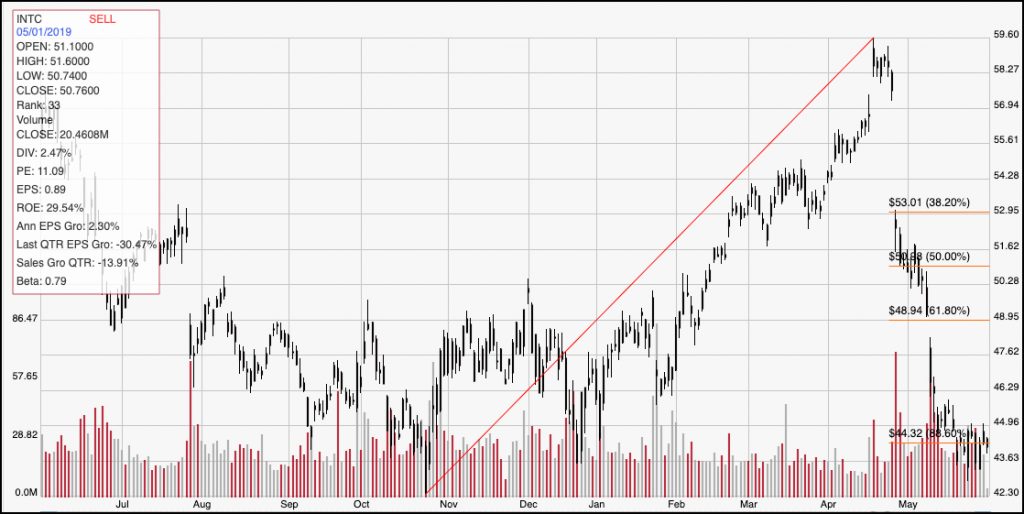
Current Price Action/Trends and Pivots: The diagonal red line traces the stock’s upward trend from October of last year to mid-April; it also informs the Fibonacci retracement lines shown on the right side of the chart. The stock’s drop from that high looks like a free-fall, with big gaps in the last week of April and the early part of May making up the biggest portion of that slide. The stock does look like it could be finding a stabilization level at around $43.50, right in line with the 88.6% retracement line. If this level doesn’t hold, the next most likely level of support is probably at around $36 based on previous pivot highs that were last seen in the summer of 2017. If you’re looking for a bullish move, the stock would really need to push above the mid-point of the stock’s early May gap downward, which if probably in the $47 range before there is likely to be enough momentum to sustain a continued bullish rally higher, with a break above the 61.8% retracement line at about $49 really the calling card for any kind of legitimate new upward trend.
Near-term Keys: It’s hard to see where any kind of bullish short-term trade would be a good idea right now, given the strength and momentum of the stock’s current bearish trend. A very aggressive trader might consider betting on a bullish bounce from the stock’s current level to about the $47 to $48 level for a short-term trade using call options; but that is a very speculative trade. The smarter bet right now is to look for a break below $43 as a signal to short the stock or buy put options with a short-term target price at around $36 per share. The stock’s value proposition right now is interesting, but not really compelling, even with the stock’s big drop over the last six weeks. Given the state of trade, and the stock’s current momentum, I think it’s smarter to wait to see stronger signs of stabilization in the stock, or indications of a positive breakthrough on the trade front.