All year long, just about every other kind of news item that might normally serve to move the market – interest rates, inflation, corporate earnings – all seem to have taken a back seat to the spectacle that has become trade and tariffs between the U.S. and China. If the stock market can sometimes be likened to a circus – where so many things are often happening in multiple places that keeping track of it all is a challenge – then the standoff between Beijing and the Trump administration is directly in the middle ring. This last week, though a new geopolitical event began to claim its place in national view and commentary.
On Thursday, an unmanned U.S. drone was shot down by Iranian forces in the Persian Gulf – what U.S. officials maintain followed an Iranian attack of two oil tankers with mines just outside the Strait of Hormuz. Are these reactions to the U.S. sanctions that were reinstated last year by the Trump administration after pulling out of a 2015 deal put together by the Obama administration. Those sanctions have already hit the Iranian economy hard, and now Trump appears set to impose even harsher sanctions beginning on Monday.
Political tensions in the Middle East historically have always served to push oil prices higher, which is why this news has started making waves in the market. In fact, West Texas Intermediate crude (WTI) has rebounded form a pivot low around $51 per barrel a week and half ago to its current level just a little below $58. That’s an increase of about 14%, and it has helped to lift the entire oil sector by a little under 4% in the last month., as measured by the S&P 500 Energy Sector SPDR (XLE). That is something that will work in the favor of oil exploration and production companies, and also for the companies that provide the equipment and services those businesses need.
Schlumberger N.V. (SLB) is one of the largest companies in the world in the Energy Equipment & Services industry. It has also vastly underperformed the rest of the energy sector; while XLE is down about -15% over the last year, SLB has dropped by nearly -41%, with its multiyear high at about $80.50, reached in January of 2018. The stock has rebounded with the sector over the last couple of weeks from a fresh 52-week low at around $34.50, and is also about 4% higher over that period as of this writing. Has the stock finally found a usable bottom, with broader economic conditions and events working in the stock’s favor? If so, is the stock’s decline over the last year and a half extended enough to translate to a useful value opportunity? Let’s dive in and find out.
Fundamental and Value Profile
Schlumberger N.V. provides technology for reservoir characterization, drilling, production and processing to the oil and gas industry. The Company’s segments include Reservoir Characterization Group, Drilling Group, Production Group and Cameron Group. The Reservoir Characterization Group consists of the principal technologies involved in finding and defining hydrocarbon resources. The Drilling Group consists of the principal technologies involved in the drilling and positioning of oil and gas wells. The Production Group consists of the principal technologies involved in the lifetime production of oil and gas reservoirs and includes Well Services, Completions, Artificial Lift, Integrated Production Services (IPS) and Schlumberger Production Management (SPM). The Cameron Group consists of the principal technologies involved in pressure and flow control for drilling and intervention rigs, oil and gas wells and production facilities. SLB has a current market cap of $53.9 billion.
Earnings and Sales Growth: Over the last twelve months, earnings decreased -21%, while sales were flat, but positive by about .5%. In the last quarter, earnings dropped by a little over -16.5% while sales declined by -3.6%. SLB’s Net Income versus Revenue over the last year was 6.18%, but narrowed somewhat in the last quarter to about 5.34%. Those levels are significantly lower than they were in mid-2015, as the energy sector was just reaching a peak in oil prices. At that time, SLB’s Net Income was about 11%.
Free Cash Flow: SLB’s Free Cash Flow is healthy, at a little more than $3.35 billion. That translates to a Free Cash Flow Yield of 6.2%. The Free Cash Flow Yield number is useful when you look at the company’s Free Cash Flow in mid-2015, at the peak of the last boom period for the sector. SLB’s yield at that time was 6.4% – only a little higher. The entire sector has faced big headwinds for most of the last four years that have kept oil prices well off of their 2014-2015 highs, which were around $100 per barrel. I think the fact that SLB’s Free Cash Flow Yield has remained consistent through that period is a mark of the company’s underlying strength.
Debt to Equity: SLB has a debt/equity ratio of .45, which is conservative and indicates the company has a disciplined approach to debt management. While the company’s cash and liquid assets have declined significantly since the beginning of 2016, they also totaled more than $2.15 billion in the most recent quarter. Their balance sheet indicates that operating margins are more than adequate to service the company’s debt, which was about $16.5 billion in long-term debt in the last quarter.
Dividend: SLB pays an annual dividend of $2.00 per share, which at its current price translates to a dividend yield of about 5.14%. The stock’s dividend offers a compelling reason for patient investors to hold this stock, with a current yield well above even long-term Treasury yields, which have been dropping and are below 3% right now.
Price/Book Ratio: there are a lot of ways to measure how much a stock should be worth; but one of the simplest methods that I like uses the stock’s Book Value, which for SLB is $26.37 per share. At the stock’s current price, that translates to a Price/Book Ratio of 1.47. The stock’s historical Price/Book ratio by comparison is 2.32 and puts the top end of the stock’s long-term price target at around $61 per share. The stock’s Price/Cash Flow ratio provides a more conservative target at around $52, since SLB is currently trading a little more than 36% below that historical average. Either way, the long-term upside from the stock’s current price level looks very attractive right now.
Technical Profile
Here’s a look at the stock’s latest technical chart.
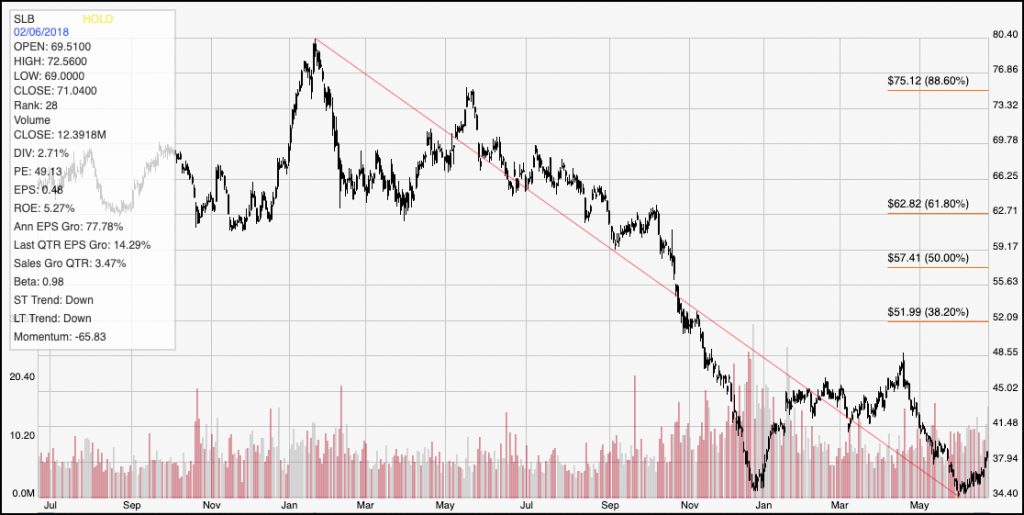
Current Price Action/Trends and Pivots: SLB’s downward trend is pretty easy to recognize on this chart, with the latest trend low only coming within the last couple of weeks. The stock is currently showing some bullish momentum, having rallied off of its trend low at around $34.50 to its current price a little above $38. Immediate resistance is between $41 and $45 per share, with support back at that $34.50 low. in order to establish a new, legitimate short-term upward trend, the stock would need to break above $45, with room to run from that point to about $52, where the 38.2% retracement line sits.
Near-term Keys: The truth is that the stock is plumbing 10-year lows right now that have provided strong support on two different occasions in the $34.50 price area. That bodes well for the stock’s near-term price stability. If you like the stock’s current bullish momentum, there is even an argument to be made for a momentum-based trade using call options or simply buying the stock, with a profit target in the $41 to $45 range. From a fundamental basis, it is true that SLB has shown some deterioration in critical areas like Net Income and escalating debt; but these are also patterns that aren’t all that unusual for stocks in this industry over the last few years. The company’s stability in Free Cash Flow, and still healthy liquidity are also positive fundamental indications, and help to make the stock’s attractive value proposition more compelling, so this does look like a stock that is worth a good look as a long-term value investment.