Tuesday after the market closed, Micron Technology (MU) released its latest quarterly earnings report. MU is one of the most important players in the semiconductor industry, and since semiconductors are quite literally on the bleeding edge of U.S. – China trade, it only seems natural to pay attention to the stock. Their earnings report is interesting, not only because they beat market expectations but also because of the way they talked about dealing with trade and tariffs concerns.
While most U.S. semiconductors stocks have a significant level of exposure to trade risk, MU might be one of the most representative of that risk. According to its own report, MU derived 13% of its revenue in its fiscal 2019 second quarter (prior to a U.S.-imposed ban) from Chinese tech giant Huawei. In compliance with the ban, MU immediately halted all shipments to Huawei. That’s a big chunk of revenue, and profitability coming from a single customer, and so as trade concerns have continued, and even escalated, it isn’t all that surprising to see MU’s stock, and the entire industry by extension, get pretty beaten up.
The interesting part of MU’s earnings story this week is actually twofold. First, as it relates to Huawei, MU’s CEO explained that to ensure compliance with the federal ban, MU suspended all shipments to Huawei and reviewed all of the Micron products sold to Huawei. As a result, they found that while the ban applied broadly to their Huawei sales, there was also, as he described, a “subset of current products” that are not subject to export administration guidelines or entity list restrictions. Micron has resumed shipping on those orders to Huawei in the last two weeks. That doesn’t mean that the remaining suspended shipments won’t make an impact on future earnings reports, of course, but it does mean that the path ahead may be less bumpy than most expect.
The second piece of information that is useful was the statement from MU’s CFO that they have so far managed to mitigate 90% of the impact of tariffs imposed over the course of the trade war, and further that the extra cost has had a minimal effect on profit margins. The market took both nuggets as positives, and used them to push MU stock more than 13% higher in Wednesday’s trading session. The entire industry saw a nice boost, too – as measured by the Philadelphia Exchange Semiconductor iShares ETF (SOXX), it managed to move a little more than 3% higher yesterday. It would seem that the market is taking MU’s news as an indication, as well, that other companies besides MU may be able to find their own creative ways to navigate the landscape of tariffs and trade tensions.
Xilinx Inc. (XLNX) is another semiconductor stock that, like MU derives a major portion of its sales from shipments to Huawei. From July of last year to the end of April, the stock more than doubled in price, but the Huawei ban and broader semiconductor supply issues all served to push the stock off of an all-time high at nearly $142 per share to as low as $101 in just a couple of weeks. The stock has managed to rally about 10% higher in the last month, with a nice increase of nearly 4% yesterday. The stock clearly appears to be one of the residual beneficiaries of MU’s positive news, and could be poised for continued near-term upside. It also stands near the top of the industry in terms of some of my favorite fundamental metrics. That begs the question: is it also a good value? Let’s find out.
Fundamental and Value Profile
Xilinx, Inc. (Xilinx) is engaged in designing and developing programmable devices and associated technologies. The Company’s programmable devices and associated technologies include integrated circuits (ICs) in the form of programmable logic devices (PLDs), including programmable System on Chips (SoCs) and three-dimensional ICs (3D ICs); software design tools to program the PLDs; targeted reference designs; printed circuit boards, and intellectual property (IP), which consists of Xilinx, and various third-party verification and IP cores. The Company provides design services, customer training, field engineering and technical support. Its PLDs include field programmable gate arrays (FPGAs), complex programmable logic devices (CPLDs) that its customers program to perform desired logic functions, and programmable SoCs, which combine (Advanced reduced instruction set computing (RISC) Machines (ARM)) processor-based systems with programmable logic in a single device. XLNX has a current market cap of $28.7 billion.
Earnings and Sales Growth: Over the last twelve months, earnings increased by 22%, while sales increased 23%. In the last quarter, earnings growth was modest, at a little over 2% while Revenues also grew by about 3.5%. XLNX’s Net Income versus Revenue is sturdy, and consistent; over the last year this number was 29%, and while other stocks in the industry have seen this number shrink in the last quarter, it actually grew somewhat for XLNX, to 29.5%.
Free Cash Flow: XLNX’s Free Cash Flow is healthy, but modest at a little more than $1 billion. That translates to a most unremarkable Free Cash Flow Yield of 3.45%.
Debt to Equity: XLNX has a debt/equity ratio of .46, which is a good reflection of the company’s conservative approach to leverage. Their balance sheet shows almost $3.2 billion in cash and liquid assets against just $1.2 billion in long-term debt. When you combine this element with their strong Net Income, I think it becomes easier to think that XLNX could be finding its own way through trade issues, and simply adjust to the “new normal” that ongoing tariffs are beginning to represent.
Dividend: XLNX pays an annual dividend of $1.48 per share, which at its current price translates to a dividend yield of about 1.35%. That is modest, but it is also less than 50% of the stock’s earnings per share over the last twelve months – a conservative payout ratio that actually helps bolster the company’s balance sheet strength.
Price/Book Ratio: there are a lot of ways to measure how much a stock should be worth; but one of the simplest methods that I like uses the stock’s Book Value, which for XLNX is $11.27 per share. At the stock’s current price, that translates to a Price/Book Ratio of 10.13. This is where the first cracks in XLNX’s bargain proposition really start to show up, since the stock’s historical Price/Book ratio by comparison is just 6 and puts the top end of the stock’s long-term price target more than -68% below the stock’s current price, at $36.55. The stock’s Price/Cash Flow ratio also makes the stock look overvalued; while the number is smaller, at -29.5%, it still puts the stock’s “fair value” around $80 per share and around levels it last saw at the end of 2018.
Technical Profile
Here’s a look at the stock’s latest technical chart.
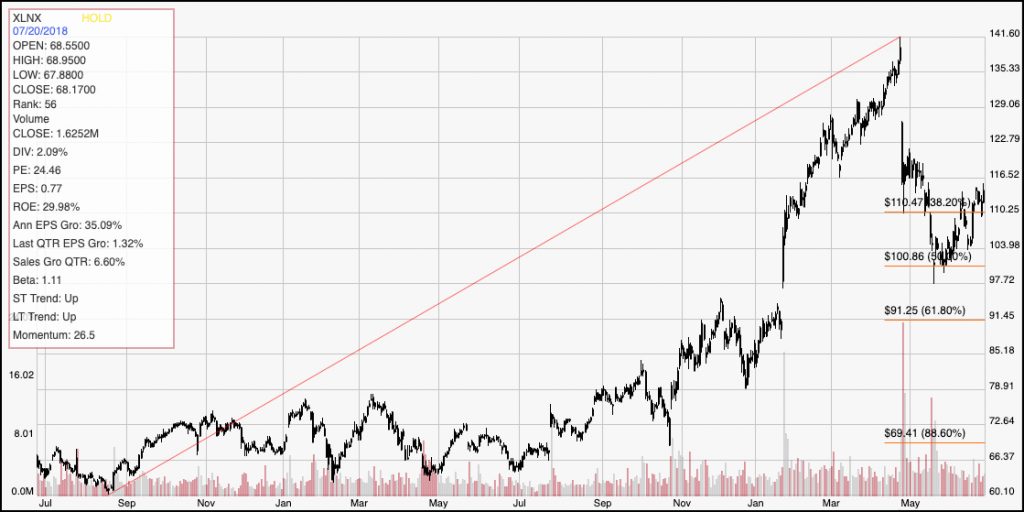
Current Price Action/Trends and Pivots: The red diagonal line defines the stock’s upward trend over about the last eighteen months, to its long-term peak at around $142 per share; it also informs the Fibonacci retracement lines shown on the right side of the chart. Trade pressure, including concern related the Huawei ban saw the stock drop all the way to the 50% retracement line at around $100 before rebounding and pushing a little above the 38.2% retracement line at about $110. That level should now act as support for the stock, and could give XLNX an extra boost in the near-term to push up to its next most likely resistance point, somewhere between $122 and $125 per share. A break below $110, on the other hand, could signal a new test of the recent pivot low at around $100.
Near-term XLNXs: The stock’s fundamentals are strong, but the truth is that with the stock’s “fair value” far below its current price, there isn’t really any way to call XLNX a bargain right now. That said, the stock’s current pattern, with a strong rally off of pivot support and a recent break above resistance from the 38.2% retracement line do look like a strong bullish signal to buy the stock or work with call options with a near-term target price somewhere between $121 and $125 per share. If the stock’s momentum wanes, and it actually drops below support at $110, you could read that as a signal to consider shorting the stock or buying put options, with the next likely support level in the $100 price area providing an attractive exit point.