After watching a wide swath of sectors in the market correct during the month of May as trade tensions seemed to doom the market to the inevitability of long-term tariffs, it seemed like the market could be set to drop back close to the near-bear-market levels we saw at the end of 2018. Instead, the market rallied; investors has used assurances from the Federal Reserve about future adjustments to interest rate policy, along with the hope of progress on the trade front to rally to a new set of all-time highs from the major indices.
The tech sector has been among the strongest performers during this latest rally, moving almost 10% higher over the past month. That includes Information Technology companies like Cognizant Technology Solutions (CTSH), which has itself increased in value by more than 11% since the beginning of June. That rally in the stock represents a pivot from a multi-year low a little below $57 per share. The stock’s trend over the last fifteen months is sharply bearish, having dropped steadily from a high above $85 to its current level.
The stock’s trend belies both the company’s underlying fundamental strength and the trend for its industry, putting CTSH in the category of one of the biggest losers in the stock market of the past year. At the same time, however, that long, extended move down has put the stock’s price down at levels that appear to offer an interesting long-term opportunity. Is the bargain proposition to be believed? Let’s take a look.
Fundamental and Value Profile
Cognizant Technology Solutions Corporation is a professional services company. The Company operates through four segments: Financial Services, Healthcare, Manufacturing/Retail/Logistics, and Other. The Financial Services segment includes customers providing banking/transaction processing, capital markets and insurance services. The Healthcare segment includes healthcare providers and payers, as well as life sciences customers, including pharmaceutical, biotech and medical device companies. The Manufacturing/Retail/Logistics segment includes manufacturers, retailers, travel and other hospitality customers, as well as customers providing logistics services. The Other segment includes its information, media and entertainment services, communications and high technology operating segments. Its services include consulting and technology services and outsourcing services. Its outsourcing services include application maintenance, IT infrastructure services and business process services. CTSH has a current market cap of $35.9 billion.
Earnings and Sales Growth: Over the last twelve months, earnings decreased by -8%, while sales increased 5%. In the last quarter, earnings declined a little over -7% while Revenues were mostly flat, but also negative by about -0.5%. The negative earnings pattern is one of the primary reasons for the stock’s underperformance over the last year. CTSH’s Net Income versus Revenue is healthy, but has also shown signs of decline, dropping from 12.38% over the last twelve months to 10.7% in the last year. This is generally taken as a sign that costs are increasing and that the company is becoming less efficient. This could also be tied to some extent to a variety of geopolitical issues, since CTSH’s global footprint leave it exposed to risks that include tariffs (Europe and China; while European tariffs by the U.S. have taken a backseat to the trade war with China, they are still in place) to still unresolved questions and concerns about Brexit.
Free Cash Flow: CTSH’s Free Cash Flow is healthy, at a little more than $2 billion. That translates to a Free Cash Flow Yield of 5.81%.
Debt to Equity: CTSH has a debt/equity ratio of .12, which is a good reflection of the company’s conservative approach to leverage. Their balance sheet shows almost $3.7 billion in cash and liquid assets against a little less than $1.4 billion in long-term debt. These are strongly positive indicators that give the company excellent liquidity and financial flexibility to adapt to ongoing changes in the markets it operates in.
Dividend: CTSH pays an annual dividend of $.80 per share, which at its current price translates to a dividend yield of about 1.27%. That is modest, but it is also much less than 50% of the stock’s earnings per share over the last twelve months – a conservative payout ratio that actually helps bolster the company’s balance sheet strength.
Price/Book Ratio: there are a lot of ways to measure how much a stock should be worth; but one of the simplest methods that I like uses the stock’s Book Value, which for CTSH is $19.57 per share. At the stock’s current price, that translates to a Price/Book Ratio of 3.22, which puts the stock’s “fair” value at about $73.58 per share. That’s only about 16.6% away from the stock’s current price, which isn’t bad, but not quite compelling as a value-based metric; however the stock is also trading more than 46% below its historical Price/Cash Flow ratio, which offers a top-end, long-term target price a little above $92 per share. That is above the stock’s all-time high at around $85 per share, and so it might be a little over-optimistic, but it also helps put that high in range on a long-term basis.
Technical Profile
Here’s a look at the stock’s latest technical chart.
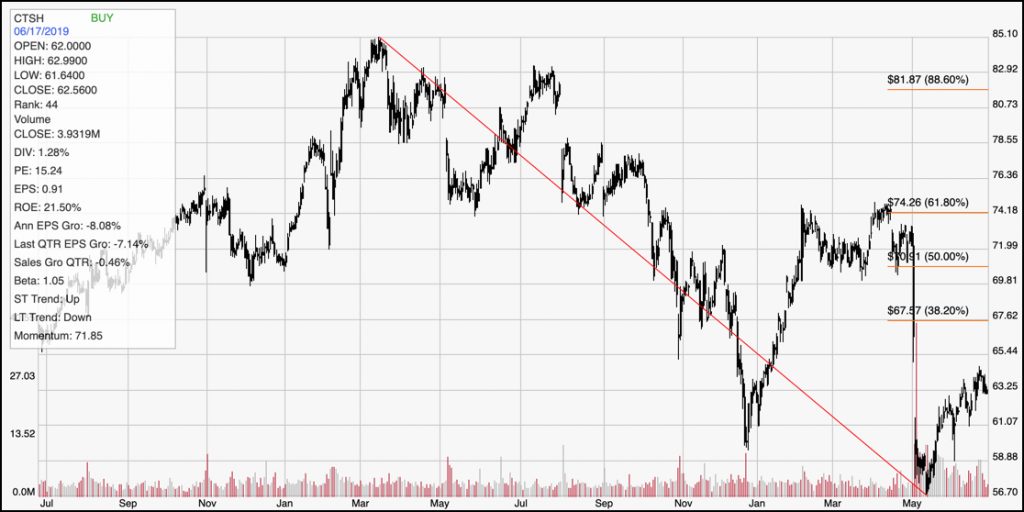
Current Price Action/Trends and Pivots: The red diagonal line defines the stock’s downward trend from March of 2018 to its trend low earlier this month; it also informs the Fibonacci retracement lines shown on the right side of the chart. Like most stocks in the tech sector, the stock rebounded nicely in the early part of the year, pushing up to the 61.8% Fibonacci retracement line in April; but from that point the path back down was sharp and fast, with the stock pushing down to a new multi-year low just below $57. The stock’s rally this month is attractive, and it does appear to be building useful bullish momentum right now, but in the near term that momentum could be capped at about $67.50, which is where the 38.2% currently rests. The stock would really need to push above that level in order to offer any kind of legitimate new upward trend. If the stock drops back to current support at its trend low around $57, and pushes below it, its next support could lie somewhere between $49.50 and $51.50 per share based on pivot points last seen in 2017.
Near-term CTSHs: The stock’s fundamentals are strong, and overall the bargain proposition is appealing; however it is worth noting that industry analysts right now are forecasting stagnant to tepid growth in revenues and profits for the company for the next year or so, which means that while the stock looks attractive from a valuation standpoint, a push back near to its all-time highs is likely to be an extended, very long-term prospect. If you prefer to work with shorter-term trading strategies, you could use a break above the stock’s most recent pivot high at about $64 as a signal to buy the stock or work with call options, with a near-term exit target at around $67.50. There could also be a bearish opportunity, although you’d have to wait to see the stock push to a new multi-year low below $57 to see a good signal for a bearish opportunity to short the stock or to buy put options. In that case, the exit target would be around $51 per share.