It’s always interesting to watch the way market sentiment and investor attention shifts over time. For most of the year, the market has unsurprisingly been taking most of its queues from trade, with investors increasingly pricing in an expectation that a deal with be reached between the U.S. and its trading partners eventually. Over the last couple of weeks, a couple of other elements have been able to find their way through all the talk and speculation over trade and have also started to drawn enough attention to add a couple of other talking points to the backdrop of market momentum and pace.
Interest rates, which have always had the ability to offer direction to investor sentiment have come to the fore, with the Federal Reserve apparently softening its stance about rates, allowing the expectation that they could cut interest rates as early as this month to enter the marketplace. That’s been a positive that has helped the market push to new all-time highs. As we move into a new earnings season, however we now have a third market leg that I’m seeing a lot more commentary and analysis about. It appears that most analysts are forecasting a decline in earnings from S&P 500 stocks during this season of as much as -3% or more. Trade pressures are part of the reason, but I’m also seeing a lot of them point to the fact that the positive effects of the Trump administration’s tax cut in late 2017 are going to begin to fade into the background. A lot of large-cap stocks have been able to use those cuts to book big gains in earnings over the last year; whether the roll through of that temporary relief will now translate to earnings pressure remains to be seen. For now, however that does offer an element that could add to market uncertainty. If you think of the market as a three-legged stool, with trade, interest rates, and earnings as the legs, there are two legs – trade and earnings – that seem to offer potential for strength or weakness in the near term. That is a stool that I think sounds like it could be pretty wobbly.
That potential for greater weakness in the market is one of the big reasons that I continue to believe a measured approach to new long-term positions is warranted. That also means that when you have an opportunity to be defensive, it’s usually a good idea to take it seriously. One of the ways that a lot of people like to get defensive – to find useful “safe haven” investments – is to work with precious metals like gold and silver. Working with the commodities themselves can be a good way to directly hedge against market risk. The Fed’s currently accommodative stance towards interest rates should be a positive for metals like gold, which usually respond bullishly to lowering interest rates. Trade disputes and geopolitical tensions are issues that lend to greater economic risk, which should also translate to support for gold prices in the near term.
If you don’t want to work directly with the commodity itself, another alternative is to invest in the companies that mine, process, and produce it. Barrick Gold Corp (GOLD) is one of the largest gold miners in the world, with operations in Canada, the United States, Central and South America, and Australia. The stock has already seen a big increase in price since the beginning of June, rallying from a little below $12 a share to a current price a bit above $16 as of this writing. That pattern corresponds well with the commodity itself, which has increased in value about 13.5% over the same period as measured by the SPDR Gold Shares ETF (GLD). If market conditions persist as they currently stand, with trade as an ongoing, unresolved point of tension, geopolitical dynamics like Iran and North Korea, and with earnings uncertainty added to that mix, it could be a very good time to think seriously about adding a position with precious metals exposure to your portfolio. Does that mean that GOLD is a company that could act as a good proxy? Let’s dig in and find out.
Fundamental and Value Profile
Barrick Gold Corp is a gold mining company. The Company is principally engaged in the production and sale of gold and copper, as well as related activities, such as exploration and mine development. The Company’s segments, include Barrick Nevada, Golden Sunlight, Hemlo, Jabal Sayid, Kalgoorlie, Lagunas Norte, Lumwana, Porgera, Pueblo Viejo, Turquoise Ridge, Veladero and Zaldvar. Pueblo Viejo, Lagunas Norte, Veladero and Turquoise Ridge are its individual gold mines. The Company, through its subsidiary Acacia, owns gold mines and exploration properties in Africa. Its Porgera and Kalgoorlie are gold mines. Zaldivar and Lumwana are copper mines. The Pascua-Lama project is located on the border between Chile and Argentina. The Company owns a number of producing gold mines, which are located in Canada, the United States, Peru, Argentina, Australia and the Dominican Republic. GOLD has a current market cap of about $28.6 billion.
Earnings and Sales Growth: Over the last twelve months, earnings have declined by about -26.5%, while revenues improved nearly 17%. The company’s margin profile is a reflection of their troubling earnings pattern, but appears to be improving; over the last twelve months, Net Income was a troublesome -21%, but has shifted dramatically in the last quarter to 5.3% in the last quarter. Is the improvement a one-time event? Maybe; but it would be worth paying attention to this metric for the next few quarters. If the trailing twelve-month number can show steady improvement, that should be a sign of stabilization in the company’s margins and operating profile.
Free Cash Flow: GOLD’s free cash flow is modest at $401 million over the last year. That translates to a Free Cash Flow Yield of 1.38%. That doesn’t sound particularly impressive, and it should be noted that the company’s free cash flow has declined steadily from a high around $1.7 billion in mid-2016. This is another measurement that I would ideally like to see improving from one quarter to the next to be useful at its currently modest levels.
Debt/Equity: The company’s Debt/Equity ratio is .3, reflecting a conservative approach to leverage. Their balance sheet, in fact is a point of strength, since cash and liquid assets have improved since the beginning of 2019 from $1.57 billion in January to $2.15 billion in the last quarter. Long-term debt currently stands at $5.5 billion, versus more than $12.5 billion in January of 2015.
Dividend: GOLD’s annual divided is $.16 per share and translates to a yield of about 1% at the stock’s current price.
Price/Book Ratio: there are a lot of ways to measure how much a stock should be worth; but one of the simplest methods that I like uses the stock’s Book Value, which for GOLD is $10.45 and translates to a Price/Book ratio of 1.56 at the stock’s current price. The stock’s historical average Price/Book ratio is 2.33, which provides a target price for the stock at about $24.35 per share. That’s pretty attractive, since that is currently about 49% above the stock’s current price.
Technical Profile
Here’s a look at the stock’s latest technical chart.
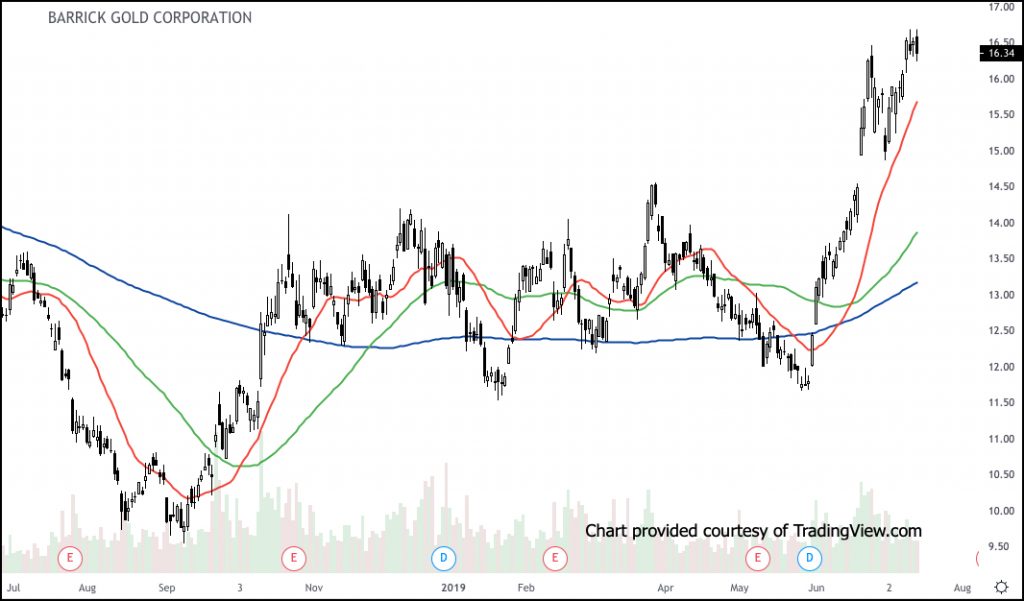
Current Price Action/Trends and Pivots: The chart above shows the last twelve months of price activity for GOLD. The stock’s current short-term upward trend is easy to see, and is a good indication of the positive effect that trade, geopolitics, and more recently, interest rates have all had on the gold market. Will that momentum persist? That remains to be see. The stock is currently sitting at resistance, right around $16.50 per share, with closest support at around $15 per share. A push above $16.50 will probably see the stock rally in the short-term to about $18.50 per share, while a drop below $15 could set up further weakness down to about the $14 level. The stock would need to drop below $13, however to mark an actual reversal of the current upward trend; that mark is set by the blue line on the chart above, which measures the 200-day moving average, an indicator most technicians like to use to measure a stock’s long-term trend.
Near-term Keys: Is GOLD a strong value? The stock’s valuation metrics seem to suggest it could be; but the truth is that the company’s negative Net Income over the last twelve months, and declining Free Cash Flow are concerns that make hesitant to put the value label on this stock. The stock’s current price performance also suggests that the better rationale for working with this stock is to think about it as a proxy for working with precious metals directly. That could offer an interesting way to leverage this segment of the economy for useful short-term trades, with a break above $16.50 providing a good signal to think about buying call options with an eye on the $18.50 level as an exit point. On the bearish side, a drop below $15 could offer an interesting opportunity to short the stock or to buy put options, with a target somewhere between $13 and $14 per share.