While the rest of the market has been pushing to a new set of all-time highs – as of the end of last week, the S&P 500 was up nearly 19% year-to-date – the energy sector has been struggling lately. As measured by the S&P 500 Energy Sector SPDR ETF (XLE), the sector is down about -10% since peaking in late April, and roughly -20% since October of 2018. That pressure has been felt in a lot of segments of the sector, with major names like Marathon Oil (MRO), Chevron (CVX), Halliburton (HAL) and Schlumberger (SLB) all seeing declines over the last year of -20% or more in their own stock prices.
The sector’s underwhelming performance seems to be attracting the attention of a lot of analysts lately, many of which are taking note of the fact that many of these companies have been booking solid cash flows and strengthening balance sheets even as pressure on oil prices has kept the commodity somewhat below most forecasts for 2019. Those pressures come from geopolitical concerns that include trade and tariffs as well as re-imposed sanctions on Iran have raised tensions in the Middle East. Even so, most industry analysts continue to forecast long-term stabilization of crude prices into 2020, with the price of West Texas Intermediate crude (WTI) expected to average between $66 and $71 per barrel. That’s quite a bit above its current price, which has been fluctuating somewhere between $52 and $61 over the past several weeks.
Volatility in crude prices, which is generally the primary catalyst for the profitability of companies in the energy sector, is probably the biggest reason that a lot of investors shy away from working with this sector. I can understand the hesitation, but at the same time I also believe that the fundamental strength underlying the sector shouldn’t be discounted. The sector is just a few years removed from one of its most significant bear markets in recent memory, when oil prices plunged from around $100 per barrel to below $30 from late 2014 to early 2016. During that plunge, I saw a number of industry executives talk about efforts to improve operational efficiency by investing in technological improvements. At the time, those executives talked at length about their goal, which was to enable their businesses to be profitable even if oil didn’t rediscover its earlier highs. In fact, the price target for the commodity most used as a reference point was usually around $50 per barrel.
That operational efficiency is one of the biggest reasons that I think the energy industry is one of the biggest bargains in the entire stock market right now. That opinion includes many of the big-name companies I listed earlier, as well as smaller players like Continental Resources Inc (CLR). This is a stock whose price performance would naturally make most investors nervous; after hitting a high at around $72 in October of last year, the stock is about -50% lower as of this writing, with almost -12% of that drop coming in just the last week. With a strong fundamental profile, including a very solid, improving balance sheet and impressive value proposition, however, this could be the kind of stock that a long-term oriented investor should be paying more attention to.
Fundamental and Value Profile
Continental Resources, Inc. is a crude oil and natural gas company with properties in the North, South and East regions of the United States. The North region consists of properties north of Kansas and west of the Mississippi River and includes North Dakota Bakken, Montana Bakken and the Red River units. The South region includes properties south of Nebraska and west of the Mississippi River including various plays in the South Central Oklahoma Oil Province (SCOOP), Sooner Trend Anadarko Canadian Kingfisher (STACK), and Arkoma Woodford areas of Oklahoma. The East region is consists of undeveloped leasehold acreage east of the Mississippi River with no drilling or production operations. As of December 31, 2016, its estimated proved reserves were 1,275 million barrels of oil equivalent (MMBoe), with estimated proved developed reserves of 519 MMBoe. As of December 31, 2016, its average daily production from South region properties was 91,088 barrels of oil equivalent (Boe) per day. CLR has a market cap of $13.7 billion.
Earnings and Sales Growth: Over the last twelve months, earnings for CLR declined by about -15%, while sales decreased about -1.47%. In the last quarter, earnings grew 7.4% while revenues remained negative, at a little more than -2%. Despite the negative earnings pattern, CLR’s operating profile is healthy, with Net Income as a percentage of Revenues running at an impressive 20% over the last year, and 16% in the last quarter. The fact the number declined in the last quarter is a concern, but the fact is that it remains among the highest in the industry, and is attributable more to outside pressures – including pipeline capacity issues that have plagued shale producers throughout most of the past year, but which should start to see some relief into 2020 – than to problems with the company itself.
Free Cash Flow: CLR’s free cash flow is healthy, at about $3.2 billion million over the last twelve months. It should be noted that free cash flow has improved steadily since late 2017, from about $2.2 billion. Its current level translates to an impressive Free Cash Flow Yield of 23.8%.
Debt to Equity: CLR has a debt/equity ratio of .87. This is a conservative number that reflects a mostly conservative approach to leverage. The company’s balance sheet indicates liquidity could be a concern, since the last quarter showed just $264.37 million in cash and liquid assets against $5.77 in long-term debt. It is also important, however to note the improving pattern in both measurements. As of the end of the third quarter of 2018, cash was just $12.9 million, for example. The company has also been aggressive about paying down its debt levels, reducing long-term debt from about $7.2 billion in early 2016 to its current level.
Dividend: CLR does not pay a dividend.
Price/Book Ratio: there are a lot of ways to measure how much a stock should be worth; but one of the simplest methods that I like uses the stock’s Book Value, which for CLR is $17.62. At CLR’s current price, that translates to a Price/Book ratio of 2.05. The stock’s historical average is 3.26, which suggests the stock is undervalued by about 58%. The stock is also trading more than 71% below its historical Price/Cash Flow average; together, both of these metrics puts the stock’s long-term “fair value” target between $57 and $62 per share.
Technical Profile
Here’s a look at CLR’s latest technical chart.
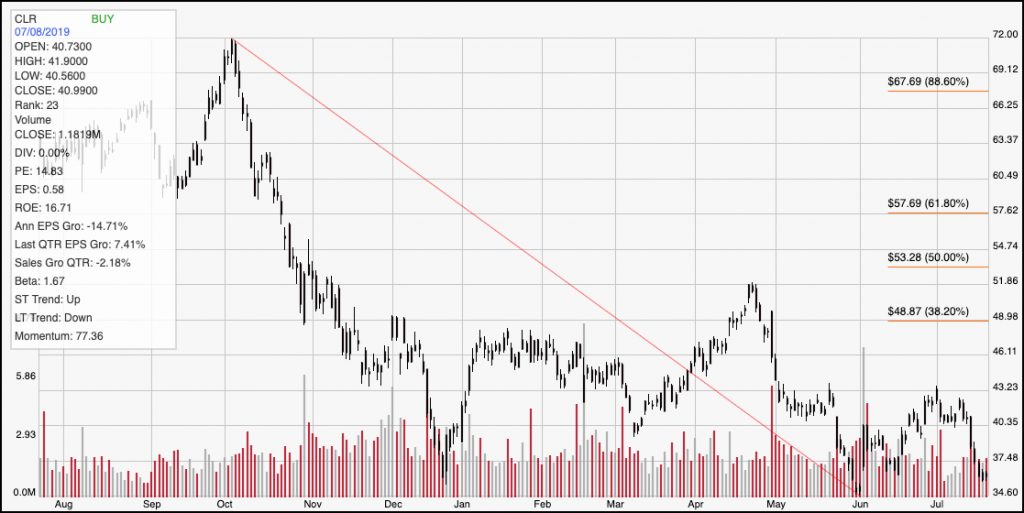
Current Price Action/Trends and Pivots: The chart above clearly shows the stock’s downward trend over the last year. The diagonal red line traces the trend from its October 2018 high to its low in June; it also informs the Fibonacci retracement lines on the right side of the chart. Since the beginning of July, the stock has seen quite a bit of negative pressure, dropping from about $43 to its current level around $36. The stock is approaching its June low point at around $34.50, which is where major support is located. CLR would need to break above the resistance at $43, to about $44 in order to build a sustainable short-term upward trend; a break of that size should give the stock momentum to push to somewhere between $49 and $51, which are both in the general area of the 38.2% Fibonacci retracement line. If the stock’s current support around $34.50 doesn’t hold, it could drop quickly to about $30 per share, a level that was last seen in mid-2017.
Near-term Keys: CLR is a good example of both the risk and the opportunity that you’ll often see associated with energy and oil-related stocks. The stock’s price volatility is something that you have to be willing to accept if you’re going to try to work with it on any kind of long-term basis; but the company’s improving balance sheet and fundamental strength are both the primary reasons I think the stock’s value proposition is real. If you prefer to work with a shorter-term time frame, and you don’t mind being a bit aggressive, you could treat a test of support int he $34.50 price area, with a pivot swing off of that level to the upside as a signal to buy the stock or work with call options; however the better probability signal would come from waiting for a break above $43 per share. If the stock breaks below $34.50, you can consider shorting the stock or working with put options with a price target at around $30 to close out a bearish trade.