Earlier this week, I wrote about Alaska Air Lines (ALK) as an interesting stock, primarily because of the fact that it doesn’t have any of Boeing’s (BA) 737 MAX, the plane that has been grounded by governments across the world after two fatal crashes that left no survivors. The aftermath hasn’t been pretty for the carriers that had made the MAX Boeing’s best-selling product, as they’ve had to cancel flights, refund tickets and start thinking about how to make up the difference. That means that airlines that don’t actually have the 737 MAX in their fleet are at a competitive advantage in the near-term, since they won’t have to deal with any of those headwinds.
Thinking about the ripple effect BA is having on the airline industry right now led me to start thinking about how to find opportunity in the midst of that chaos. If you want to play the bearish side of things, there are certainly ways to leverage the negative impact of grounded flights, extended delays in a return to service of MAX jets around the world and so on; but instead, I started to wonder if there were companies that might actually be able to stand out above the chaos. That led me to start thinking about ways that businesses can shield themselves from unexpected risks. That is what ultimately led me to ALK. It’s true to say that not having any MAX jets in their fleet wasn’t likely an attempt to hedge any kind of risk on that company’s part – but it is also fair to describe it as a turn of fortune in their favor that not many other companies can claim.
One other U.S. carrier that can make the same claim, and that might be in an even more favorable position competitively speaking, is Delta Air Lines (DAL). Where ALK is a regional carrier, focused primarily on the western region of North and Central America, DAL’s global footprint makes them one of the largest carriers in the world. While they also have no MAX jets in their fleet, another distinction is that DAL also has no pending orders for the jet awaiting resolution of the problems that grounded the plane. While that element may not have cost ALK anything as of yet, it does mean that they have to determine whether to keep their orders in place, to cancel them and try to find other ways to replace the jets those orders were intended for, and deal with all of the logistics involved in that process. It’s a complication DAL doesn’t have to deal with, which means they can simply focus on business as usual. Let’s dive in to the numbers and see what kind of long-term value proposition the company might hold as well.
Fundamental and Value Profile
Delta Air Lines, Inc. provides scheduled air transportation for passengers and cargo throughout the United States and across the world. The Company’s segments include Airline and Refinery. The Company’s route network is centered around a system of hub, international gateway and airports that the Company operates in Amsterdam, Atlanta, Boston, Detroit, London-Heathrow, Los Angeles, Minneapolis-St. Paul, New York-LaGuardia, New York- John F Kennedy International Airport, Paris-Charles de Gaulle, Salt Lake City, Seattle and Tokyo-Narita. Each of these operations includes flights that gather and distribute traffic from markets in the geographic region surrounding the hub or gateway to domestic and international cities and to other hubs or gateways. The Company’s route network includes its international joint ventures, its alliances with other foreign airlines, its membership in SkyTeam and agreements with multiple domestic regional carriers that operate as Delta Connection. DAL’s current market cap is $39 billion.
Earnings and Sales Growth: Over the last twelve months, earnings grew by almost 33%, while revenues increased by nearly 6.5%. In the last quarter, earnings improved nearly 145%, while sales grew close to 20%. The company operates with a healthy margin profile, with Net Income running at 9.87% of Revenues for the last twelve months, and increasing to 11.5% in the last quarter.
Free Cash Flow: DAL’s free cash flow is healthy, at more than $2.8 billion. That translates to a Free Cash Flow Yield of 7.25%.
Debt to Equity: DAL has a debt/equity ratio of .95. The company’s balance sheet shows that operating profits are adequate to service their debt. The company has about $2 billion in cash and liquid assets as of the most recent quarter against $13.2 billion in debt, which does verify that like most airline stocks, DAL is highly leveraged.
Dividend: DAL pays an annual dividend of $1.61 per share, which translates to a dividend yield of about 2.67% at the stock’s current price.
Price/Book Ratio: there are a lot of ways to measure how much a stock should be worth; but one of the simplest methods that I like uses the stock’s Book Value, which for DAL is $21.47 per share. That number also translates to a Price/Book ratio of 2.8 at the stock’s current price. Their historical average Price/Book ratio is 3.08. That suggests the stock is trading right now at a discount of about 9.8%, which is honestly not very much. The stock’s Price/Cash Flow ratio is actually about 2% above its historical average, which means that the long-term target price offered by both measurements is between $59 and $66 per share. That doesn’t scream bargain, but it also isn’t terribly surprising since the stock is just a little below its all-time highs a bit above $63 right now. One factor in its favor is their PEG ratio, which attempts to measure the stock’s current price against the value of expected earnings. It’s a forward-looking evaluation that many analysts like to use; a PEG ratio of 1 means the stock’s current price is in perfect sync with future earnings. DAL’s PEG ratio right now is .8, suggesting the stock could still be 20% undervalued relative to where its expected earnings growth is likely to be in the next year.
Technical Profile
Here’s a look at the stock’s latest technical chart.
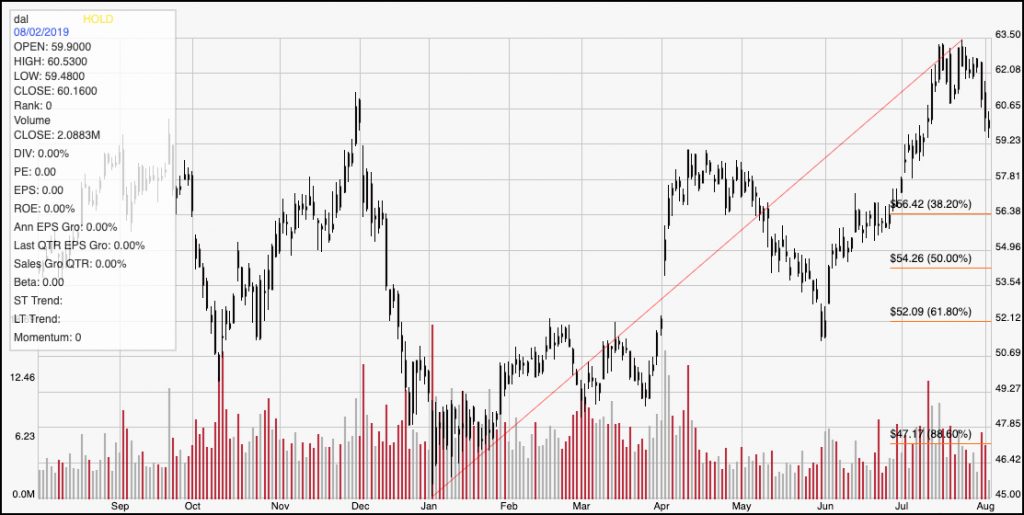
Current Price Action/Trends and Pivots: The chart above traces DAL’s price action over the last year. The red diagonal line traces its upward from from January of this year to its peak in late July. That line also informs the Fibonacci retracement lines shown on the right side of the chart. The stock is dropping from that July high, but is still about $4 per share away from the 38.2% retracement line that is sitting just a little above $56 per share. The stock looks to have near-term support between $59 and $60, based the pivot high we can see in April. A push above $63 would reconfirm the stock’s longer-term upward trend, while a break below $59 would signal the beginning of a new short-term downward trend.
Near-term Keys: I think making a long-term bet on DAL is a bit of risk right now given the limited upside I think the stock may see. The fundamentals are solid, but trade concerns around tariffs, and industry-based sympathy related to MAX delays could both work against DAL and keep the stock working to the downside. With that in mind, treat a break below $59 as a signal to consider shorting the stock or to work with put options, with an eye on support around $56 as an exit point. If the stock breaks above $63, you could treat it as a short-term opportunity with call options; but in that case, I think the higher-probability bet is to actually go ahead and buy the stock with a long-term target in the 20% rage above the stock’s current price, which would give you an exit point at around $72 per share.