As it relates to trade, most analysts agree that the sectors that are the most sensitive to pressures from tariffs, currency devaluations, and geopolitical tensions include Industrial stocks. As trade concerns have mounted in the last month, the Industrial sector has dropped by almost -5, and is mostly flat over the last twelve months; however, year to date, the sector has still performed quite nicely, having increased by about 16.5% since the beginning of January.
It’s interesting to me that the mostly positive move this year in the sector has not bled into some of the largest companies in the sector. Conglomerates like General Electric (GE) and 3M Company (MMM) have been following long, multi-year downward trends that have put them at extreme, multiyear lows. GE has been beset by a host of fundamental problems that have driven the stock below $10 per share, and doesn’t appear be capable of making a strong case to get out of its long-term funk at any point soon. MMM is down nearly -38% after hitting an all-time high around $260 in January 2018, and is now at levels it last saw in June of 2016.
To blame MMM’s woes solely on trade is too simplistic, especially since the stock’s decline began before Trump-led concerns about trade imbalance or the imposition of tariffs on the United States’ largest trading partners; but concerns about slowing global growth, repatriation costs and taxes for the largest multinational U.S. companies, have all had their day in the sun over the last year and a half. Together, they all seem to have created a perfect storm of chaos that has prompted the stock to just recently set a new multiyear low around $155 per share.
Seeing such a large, well-established company at the extreme low end of its historical trading range is something that usually makes a value-oriented investor like me sit up and ask a couple of questions about why. Extended, long-term downward trends often point to fundamental problems with the company that really just point to a higher level of risk that I would usually prefer to work with. In the case of MMM, however, there are a lot of positives about its fundamental profile that make it hard to pin the stock’s decline on any kind of issue with the company or its management. Since that is true, the next natural question is if the stock’s extreme drop over the last 20 months is enough to mark the stock as a good bargain-based opportunity. The information there is a bit mixed, which means for MMM, value is probably in the eye of the beholder. Let’s take a look.
Fundamental and Value Profile
3M Company is a technology company. It operates through five segments. The Industrial segment serves a range of markets, such as automotive original equipment manufacturer and automotive aftermarket, appliance, paper and printing, packaging, food and beverage and construction. The Safety and Graphics segment serves a range of markets for the safety, security and productivity of people, facilities and systems. The Health Care segment serves markets that include medical clinics and hospitals, pharmaceuticals, health information systems and food manufacturing and testing. The Consumer segment serves markets that include consumer retail, office business to business, home improvement, drug and pharmacy retail, and other markets. MMM has a current market cap of $92.7 billion.
Earnings and Sales Growth: Over the last twelve months, earnings and sales both decreased, with earnings declining -15% while sales dropped a little over -2.5%. These numbers improved in the last quarter, with earnings dropping -1.35% and sales showing an increase of almost 4%. Despite the bearish earnings pattern, the company operates with an impressive margin profile, with Net Income running at 15.2% of Revenues over the last twelve months; this number also declined in the last quarter, but remains very healthy at 13.7%.
Free Cash Flow: MMM has healthy free cash flow of $5.5 billion over the last twelve months. This number has dropped a bit from the quarter prior when it was $5.7 billion, and equates to a Free Cash Flow Yield of almost 6%.
Debt to Equity: MMM has a debt/equity ratio of 1.53, which is high and implies the company is highly leveraged. As of the last quarter, the company had almost $3 billion in cash, versus $15.5 billion in long-term debt. Their healthy operating margins, along with their solid cash position suggests that servicing their debt is not a concern, and despite their high leverage, the company maintains a healthy level of liquidity.
Dividend: over the last year, MMM has paid an annual dividend of $5.68 per share, which at its current price translates to a yield of about 3.52%. MMM has a long history of maintaining, and growing its dividend.
Price/Book Ratio: there are a lot of ways to measure how much a stock should be worth; but one of the simplest methods that I like uses the stock’s Book Value, which for MMM is $17.63 per share. At the stock’s current price, that translates to a Price/Book Ratio of 9.14. The historical average for MMM is 9.02, which means that MMM is fairly valued at current price levels. The stock’s Price/Cash Flow ratio offers a more optimistic perspective since it is currently trading more than 49% below its historical average, which offers a long-term target price around $240 per share – just a bit below its January 2018 high.
Technical Profile
Here’s a look at the stock’s latest technical chart.
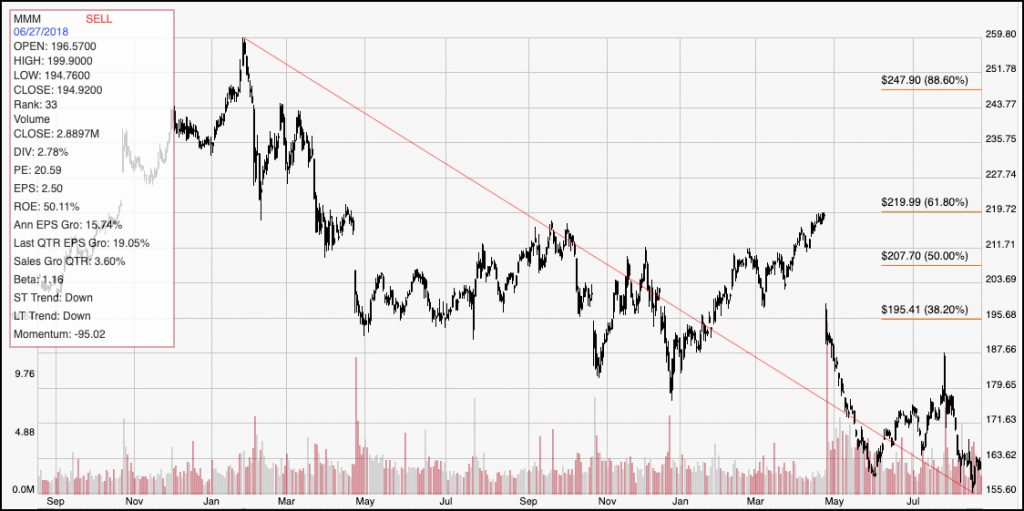
Current Price Action/Trends and Pivots: The chart above is a good representation of the stock’s movement over the past two years. The downward trend that began in January 2018 looked like it was about to reverse at the beginning of this year as the stock rallied from about $179 to almost $22 in late April; but instead the stock dropped back to set a new set of lows, with the most recent coming just a few days ago around $156 per share. The stock has rallied a bit from that point, but appears to have immediate resistance around $163. A push above $164 could give the stock room to rally to somewhere between $171 and $175, which marks pivot highs seen in the beginning of July. A new upward trend, on even a short-term basis really would not be signaled unless the stock can break above $175. If the stock breaks down further, and drops below $156, it could drop to around $150 per share.
Near-term Keys: Given the MMM’s fundamental strength, I’m tempted to use the company’s Price/Cash Flow ratio to call the stock a compelling value right now; however the stock’s currently bearish momentum, along with continued global economic concerns that extend beyond just trade, do imply that multinational stocks like MMM are still subject to a fair degree of near-term volatility. A stronger push higher would help to improve the value argument, since that would imply the market is starting to recognize the fundamental strengths associated with MMM’s profile. If you prefer to work with short-term trading strategies, and you don’t mind being a bit aggressive, you could use a break above $164 as a signal to consider buying the stock or working with call options, with a near-term exit price price in the $171 range. If the stock’s bearish momentum pushes the stock to a new multiyear low below $156, however, you could consider shorting the stock or working with put options, with an exit price for a bearish trade at around $150.