If you’re like me, it can get a bit tiresome to hear about nothing but the trade war, tariffs, and listen to market media and analysts speculate about the impact of the latest Trump tweet. It’s been more than a year that tariffs between the U.S. and its trading partners – and most particularly, China – have become practically the single point of focus to dictate market direction. It’s like listening to the same tune on the radio over and over again, with zero ability to change the station.
Adding to the anxiety, of course, and the complete inability to ignore questions and concerns about tariffs is the reality that trade pressures are clearly having an impact on corporate earnings results in the U.S., and have become a clear contributor to a slowing global economy. Trade is beginning to play such a large role, in fact, in the global economy, and looms as a big enough threat to continued U.S. growth that the Fed even took the unusual step last month of cutting interest rates despite indications the U.S. economy was still growing.
One of the real challenges individual investors face the longer trade remains a central issue for the health of both the global and U.S. economies is being able to find opportunities to invest in stocks that aren’t exposed to a measure to trade risk. More and more stocks, of every market cap, are having to deal with the impact a slowing global economy, very possibly made worse by increased tariff costs. One of the ways you can try to limit that exposure on an individualized basis is to focus on companies whose business models don’t include operations in parts of the world directly tied to tariffs.
Aflace Inc. (AFL) is a recognizable name that could fit the description I’ve just given. The company operates in two specific regional segments – the U.S. and Japan – that aren’t actually at war with each other right now over trade. That doesn’t mean the company is entirely immune to trade concerns – the stock is down about 14.5% since mid-July, which is about when the latest round of trade-induced market volatility started – but in the long-term, it is a company whose profitability is likely to be impacted less by trade than a lot of other companies in its industry. The stock’s latest drop makes the stock worth taking a look at – you decide if you think it’s a good enough value to warrant long-term investment.
Fundamental and Value Profile
Aflac Incorporated is a business holding company. The Company is involved in supplemental health and life insurance, which is marketed and administered through its subsidiary, American Family Life Assurance Company of Columbus (Aflac). The Company’s insurance business consists of two segments: Aflac Japan and Aflac U.S. The Company designs the United States insurance products to provide supplemental coverage for people having medical or primary insurance coverage. Aflac U.S. offers accident coverage on both an individual and group basis. The Company offers cancer plans, critical illness plans, and critical care and recovery plans. The Company designs the United States insurance products to provide supplemental coverage for people having medical or primary insurance coverage. Aflac U.S. offers accident coverage on both an individual and group basis. The Company offers cancer plans, critical illness plans, and critical care and recovery plans. AFL’s current market cap is $36.2 billion.
Earnings and Sales Growth: Over the last twelve months, earnings increased 5.6%, while revenues dropped slightly, by -1.4%. In the last quarter, earnings were flat, but positive, at 0.89%, while sales declined by about -2.5%. A useful counter to the uninspiring earnings results is the company healthy margin profile, with Net Income running at 14.2% of Revenues for the last twelve months, and 14.8 in the last quarter.
Free Cash Flow: AFL’s free cash flow is very healthy, at $5.5 billion. That translates to a very useful Free Cash Flow Yield of about 15.5%. It is worth nothing that free cash flow has declined since March 2019, when it was about $6.3 billion.
Debt to Equity: AFL’s debt/equity ratio is .22, which is conservative and implies the company takes a conservative approach to debt management. AFL’s cash and liquid assets in the last quarter were about $3 billion while long-term debt was about $6.2 billion; their strong margin profile does indicate that they can service their debt without any problems.
Dividend: AFL pays an annual dividend of $1.08 per share, which translates to a dividend yield of about 2.23% at the stock’s current price.
Price/Book Ratio: there are a lot of ways to measure how much a stock should be worth; but one of the simplest methods that I like uses the stock’s Book Value. AFL’s Book Value is $38.14, which means that the stock’s Price/Book ratio right now is 1.28. AFL historical average Price/Book ratio is 1.46, which means that the stock is moderately undervalued, at about 13.7%.
Technical Profile
Here’s a look at the stock’s latest technical chart.
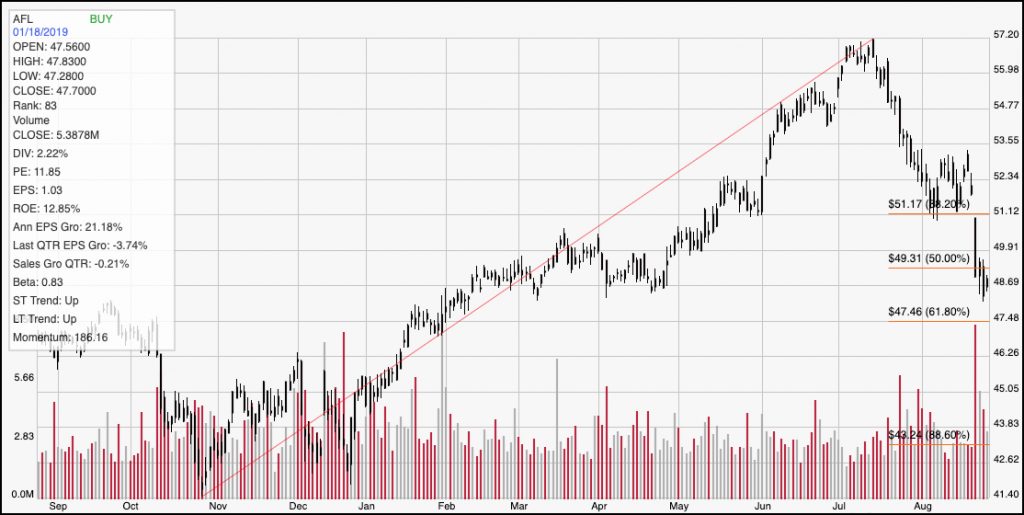
Current Price Action/Trends and Pivots: The red diagonal line traces the stock’s upward trend from November 2018 to its peak above $57 in July; it also provides the baseline for the Fibonacci retracement lines shown on the right side of the chart. The stock’s pullback from that high has put it within about $1 of the support line shown by the 61.8% Fibonacci retracement line, which could provide a useful level for the stock to consolidate and turn back to the upside. Technically speaking, that is the more likely scenario, given the strength of the stock’s upward trend over the course of the year. If the stock does form a pivot low anywhere between $47.50 and $48.50, with a push above $49.50 to confirm the short-term reversal, the stock should see short-term momentum to test the 38.2% retracement line at around $51. A further break above that point would confirm a bullish short-term trend reversal and could see the stock push up to retest its highs near to $57. On the other hand, a push below support at around $47.50 would probably give the stock room to drop to as low as about $45, based on support and resistance pivots last seen in late 2018, with the $42 level shown by the 88.6% retracement line not to far away for a further bearish target if the downward trend’s bearish momentum continues.
Near-term Keys: If the stock breaks above its recent resistance around $49.50, you could consider placing a short-term bullish trade by buying the stock itself or using call options, with a target price around $51. A drop below $47.50, however, could act as an interesting signal to think about shorting the stock or working with put options, with a near-term target price to exit a bearish trade at around $45 per share. The stock has some interesting fundamentals working in its favor, but I think current conditions and market uncertainty are unlikely to yield a lot of upside for the stock right now, and I don’t think the stock’s value argument is strong enough right now to merit strong consideration as a useful long-term opportunity. The better choice is to be patient and see if the stock can find useful support in the $44 to $45 range.