Trade, trade, trade – analysts and investors have been focusing on this single question now for more than a year. I don’t believe social media is helping the matter – President Trump tweets about increasing tariffs and calls China a trade “enemy,” and then a few days later seems to reverse course with another tweet saying China is ready to start talking again and progress is being made. Fake news? Maybe – China seems to be digging in, claiming not to know what that’s about, and that talks aren’t constructive.
Trade is the central reason that a lot of sectors like Industrials have been under a lot of pressure since mid-July, and the truth is that I don’t see that pressure fading much in the near term. Trade is becoming a cloud that seems to darken a myriad of issues right now, from U.S.-China to a slowing global economy, to interest rate policy in the U.S. as well as the profit outlook for a growing number of U.S. stocks of all sizes. Over the last month or so, the Industrial sector has dropped about 7%, with large, established stocks throughout the sector experiencing price drops in that period that is pushing them into their own bear market territory.
Cummins Inc. (CMI) is a perfect example. Since the last week of August, the stock has dropped from a high at $176 to its current level just a bit above $140 per share. Probably most widely known for its range of diesel and natural gas-powered engines for heavy trucks and agricultural markets, CMI is as sensitive to trade questions as any Machinery stock in the market., since it derives roughly 44% of its revenue from outside of the U.S. Despite that exposure, however, the fundamental numbers for CMI are very strong, and actually show a much smaller level of erosion or deterioration from the effects of trade or tariffs. That is an indication of strength that could make CMI a stock that in the long-term could offer a better opportunity than other, sexier names in the sector.
Fundamental and Value Profile
Cummins Inc. designs, manufactures, distributes and services diesel and natural gas engines and engine-related component products. The Company’s segments include Engine, Distribution, Components and Power Systems. The Engine segment manufactures and markets a range of diesel and natural gas powered engines under the Cummins brand name, as well as certain customer brand names, for the heavy and medium-duty truck, bus, recreational vehicle (RV), light-duty automotive and agricultural markets. The Distribution segment consists of the product lines, which service and/or distribute a range of products and services, including parts, engines, power generation and service. The Components segment supplies products, including aftertreatment systems, turbochargers, filtration products and fuel systems for commercial diesel applications. The Power Systems segment consists of businesses, including Power generation, Industrial and Generator technologies.. CMI’s current market cap is $22.5 billion.
Earnings and Sales Growth: Over the last twelve months, earnings increased 3.14%, while revenues increased just 1.45%. In the last quarter, earnings were flat, but positive, at 1.67%, while sales increased by 3.61%. This is one of the first areas where CMI differs from many of its counterparts, since most companies in the Machinery industry have shown a declining earnings pattern. The company’s margin profile is also very healthy and stable, with Net Income running at 10.7% of Revenues for the last twelve months, and 10.8% in the last quarter.
Free Cash Flow: CMI’s free cash flow is very healthy and improving, at $2.3 billion. At the beginning of the year, this number was about $1.7 billion. That translates to a very useful Free Cash Flow Yield of about 10.5%.
Debt to Equity: CMI’s debt/equity ratio is .18, which is conservative and implies the company takes a careful approach to debt management. CMI’s cash and liquid assets in the last quarter were about $1.7 billion while long-term debt was about $1.6 billion; their strong margin profile does indicate that they can service their debt without any problems, with healthy liquidity to boot.
Dividend: CMI pays an annual dividend of $5.24 per share, which translates to a dividend yield of about 3.66% at the stock’s current price.
Price/Book Ratio: there are a lot of ways to measure how much a stock should be worth; but one of the simplest methods that I like uses the stock’s Book Value. CMI’s Book Value is $58.28, which means that the stock’s Price/Book ratio right now is 2.45. CMI historical average Price/Book ratio is 2.9, which means that the stock is moderately undervalued, at about 15.5%. CMI’s Price/Cash Flow ratio, however offers a more optimistic outlook, since it is currently trading at nearly 25% below its historical average. Together, both ratios offer a long-term price target in the $169 to $177 price range.
Technical Profile
Here’s a look at the stock’s latest technical chart.
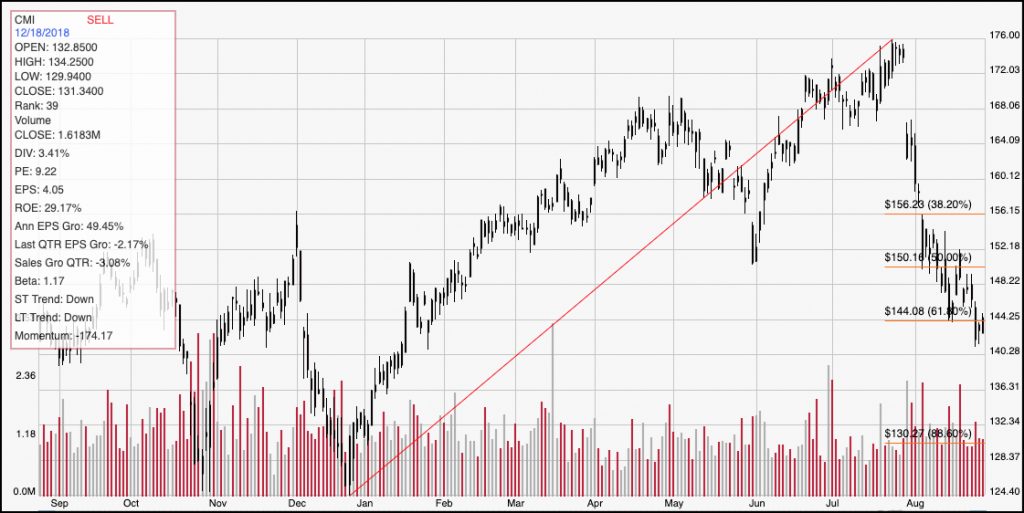
Current Price Action/Trends and Pivots: The red diagonal line traces the stock’s upward trend from January of this year to its peak at $176 in July; it also provides the baseline for the Fibonacci retracement lines shown on the right side of the chart. The stock’s pullback from that high has put the stock a little below its 61.8% retracement line, with momentum clearly running on the bearish side. That retracement line, which is around $144, should now act as resistance to any near-term upside the stock could offer, with support in the $140 range. If the stock can form a base of support and break above $144, it could have about $6 to run to the 50% retracement line, which is also where resistance is likely to be found from prior pivot levels in that range earlier in the year. A drop below $140 could see the stock drop to about $130, where the 88.6% retracement line sits, before any new, significant support is found.
Near-term Keys: CMI’s current bearish momentum seems to make any near-term bullish outlook very aggressive, with downside risk being quite a bit higher than any upside potential. If you don’t mind being aggressive, however, a break above $144 could offer a momentum-based signal to buy the stock or work with call options; but be ready to take profits quickly at around the $150 level if you do decide to place a bullish trade. The more likely scenario is that the stock will break support at $140 and offer a signal for a bearish trade, either by shorting the stock or working with put options. In that case, there is about $10 of downside opportunity to be seen, so the exit target in that case is around $130. If you are working with a long-term perspective, and the short-term downside doesn’t scare you, the truth is that CMI’s value proposition is pretty attractive, and could only get better in the days and weeks to come. This is a stock to watch closely.