Years ago, as I began my career as an investor, I read a book by Peter Lynch. Mr. Lynch had made his name, and his fortune, as the manager of Fidelity’s flagship Magellan fund in the late /70’s and ’80’s, and his incredible performance was one of the big reasons Magellan, at the time, was the largest mutual fund in America, with $14 billion in assets under management. The fund averaged an annual return of more than 29% while under his leadership, making it the top-performing fund in the world.
Shortly before retiring from the fund, Mr. Lynch wrote the book I was reading, One Up on Wall Street, in which he described the method he applied to the Magellan fund. I was surprised to see how he started simple, and much of what I learned from that book still plays a role in what I do today. Lynch popularized the idea of the “local economy,” meaning that often the best investment opportunities can be found not just within your own respective region or part of the world, but even within arm’s reach.
Finding investments at arm’s reach means recognizing the products that you, as a consumer, make use of on a regular, even daily basis. If you’re like me, most of the time, you don’t think about these items very much at all – when I go to the grocery or department store for the week with my wife, we have a list of items that we always need to have on hand, so there are certain parts of the store we always go through. Personal hygiene – shampoo, soap, toothpaste, deodorant, lotion, vitamins – check. Cleaning supplies – laundry soap, dish soap, window cleaner, surface wipes – check. Mr. Lynch helped me realize that the companies behind these products that have become a normal part of my home can also make good investing opportunities.
I like to cast a wide net when I look for value investing opportunities, and that’s why you see me try to write about stocks in just about every sector of the economy. Sometimes my desire to take the broadest approach possible means that I start to forget about what is just within arm’s reach, and so I try to remind myself even so often to come back to those stocks that make the products I already know so much about because I use them all of the time. That’s one of the reason yesterday I decided to take a look at Proctor & Gamble (PG), and it’s why today I’m writing about Johnson & Johnson (JNJ).
Johnson & Johnson is categorized as a large-cap pharmaceutical company, and the scope of the brand portfolio means that the odds you use one or more of their products on a regular is very high indeed. Whether you’re thinking about skin lotion, bath soap, adhesive bandages, aspirin or heartburn tablets, it’s a fair bet that you’ll find something made by this company on a shelf in your home. The stock has underperformed since hitting a hit point around $149 in December of 2018, and is a little over -12% below that point. This is a company with a solid fundamental basis to work from, and a value proposition that could be worth paying attention to. Let’s dive in.
Fundamental and Value Profile
Johnson & Johnson is a holding company, which is engaged in the research and development, manufacture and sale of a range of products in the healthcare field. It operates through three segments: Consumer, Pharmaceutical and Medical Devices. Its primary focus is products related to human health and well-being. The Consumer segment includes a range of products used in the baby care, oral care, skin care, over-the-counter pharmaceutical, women’s health and wound care markets. The Pharmaceutical segment is focused on five therapeutic areas, including immunology, infectious diseases, neuroscience, oncology, and cardiovascular and metabolic diseases. The Medical Devices segment includes a range of products used in the orthopedic, surgery, cardiovascular, diabetes care and vision care fields. Its research facilities are located in the United States, Belgium, Brazil, Canada, China, France, Germany, India, Israel, Japan, the Netherlands, Singapore, Switzerland and the United Kingdom. JNJ’s current market cap is $344.6 billion.
Earnings and Sales Growth: Over the last twelve months, earnings increased almost 23%, while sales declined -1.3%. In the last quarter, earnings increased by the same 23% while sales grew by 2.7%. JNJ is a company with a very healthy, strengthening margin profile. In the last quarter, Net Income as a percentage of Revenues was 27% versus 20% in the last twelve months.
Free Cash Flow: JNJ’s free cash flow is strong, at $23.7 billion. This is also a number that has increased steadily since the fourth quarter of 2016, and translates to a free cash flow yield of 6.85%.
Debt to Equity: JNJ has a debt/equity ratio of .46. This is a conservative number at first blush that generally suggests the company follows a conservative approach to leverage and debt management. Their balance sheet shows cash and liquid assets of $15.2 billion against long-term debt of $27.7 billion. Their operating profile suggests that JNJ should have no problem servicing their debt, with good liquidity as well.
Dividend: JNJ pays an annual dividend of $3.80 per share, which translates to a yield of about 2.91% at the stock’s current price.
Price/Book Ratio: there are a lot of ways to measure how much a stock should be worth; but one of the simplest methods that I like uses the stock’s Book Value, which for JNJ is $23.03 and translates to a Price/Book ratio of 5.66 at the stock’s current price. Their historical average Price/Book ratio is 4.49, which suggests the stock is overvalued, by a little more than -20%. An interesting counter to that notion is the stock Price/Cash Flow ratio, which is currently trading about 41% below its historical average, and puts a long-term target price in the $184 price range.
Technical Profile
Here’s a look at the stock’s latest technical chart.
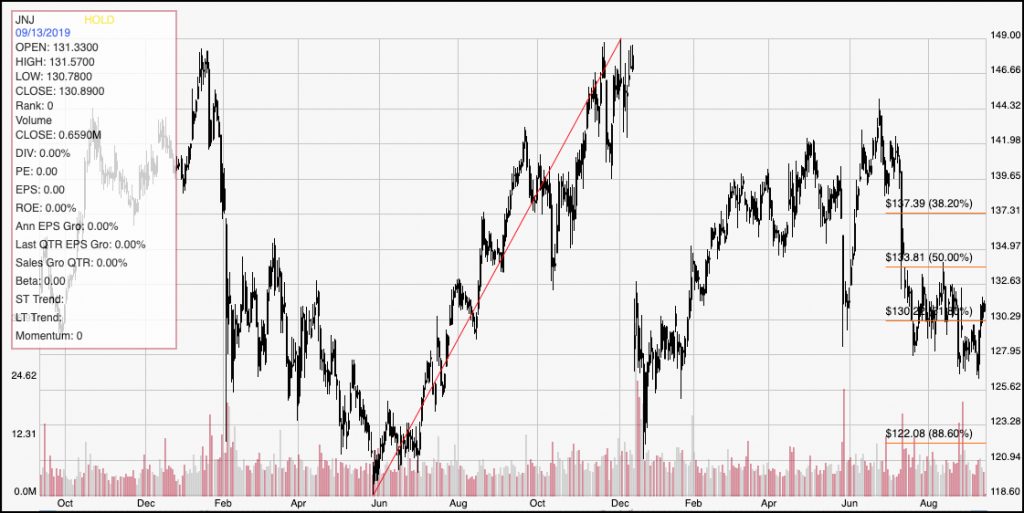
Current Price Action/Trends and Pivots: The diagonal red line traces the stock’s upward trend in the latter part of 2018, and provides the reference for calculating the Fibonacci retracement levels indicated by the horizontal red lines on the right side of the chart. The stock rallied strongly through the first several months of the year, reaching a peak at around $144 in July before dropping back from that point to the stock’s current level. In the last few days the stock has rallied off of near-term support around $126, with nearest resistance at around $132.50. If the stock can break above that level, it should see short-term upside to about $137 per share, where the 38.2% retracement line currently sits. A drop below $126 could see the stock drop all the way to $122, near the stock’s December 2018 low point.
Near-term Keys: For a value investor, JNJ’s value proposition is a bit subjective right now; whether you choose to believe the Price/Book or Price/Cash Flow metrics depends largely on your view of the stock’s overall fundamental base. The stock’s trend since July suggest there is some elevated downside risk, so it might be smart to see if the stock can build a little more bullish momentum before thinking about a long-term position more seriously.