While the weekend’s news of a partial trade deal between the U.S. and China seems to have given the market some hope that better things are ahead on the trade front, I think there are still some risks. Monday’s market action gave a pretty good view of that reality as investors tried to parse through what limited details have been made available in an effort to find a foothold to keep driving the market higher. Those details have been hard to find, and to me that means that there are still plenty of reasons to be uncertain.
Over the last couple of weeks I’ve been turning more and more of my attention back to stocks in the Consumer Staples sector, which I think is going to be a natural fit for anybody that wants to find places to invest that could represent “safe havens” within the market that aren’t as sensitive to economic downturns. Strong fundamentals have been among the reasons Hormel Foods Corp (HRL) has managed to maintain a strong upward trend since October 2017. Like most stocks in the industry, HRL dropped off of a multi-year high around $46 in September of last year to a low point in June at around $37 per share. From that point, the stock has rebounded, hitting a short-term peak at around $44 in September before dropping back to its current level around $41.
Prepackaged food stocks like HRL, CPB, KHC have all been facing significant challenges over the last couple of years related to changing consumer preferences. HRL occupies a somewhat different niche than some of these other stocks, however because its products fit nicely into that shift towards healthier choices, with a specific emphasis on proteins. Does the fact the stock has a strong fundamental profile mean that it is also a good value? Let’s take a look.
Fundamental and Value Profile
Hormel Foods Corporation is engaged in the production of a range of meat and food products. The Company operates through four segments: Grocery Products, which is engaged in the processing, marketing and sale of shelf-stable food products sold for the retail market and health and also consists of nutrition products, including Muscle Milk protein products.; Refrigerated Foods, which consists of the processing, marketing and sale of branded and unbranded pork, beef, chicken and turkey products for retail, foodservice and fresh product customers; Jennie-O Turkey Store (JOTS), which consists of the processing, marketing and sale of branded and unbranded turkey products for retail, foodservice and fresh product customers; and International & Other, which includes Hormel Foods International Corporation, which manufactures, markets and sells the Company products internationally. HRL’s market cap is about $21.9 billion.
Earnings and Sales Growth: Over the last twelve months, earnings declined -5.1%, while sales dropped about -2.9%. In the last quarter, the decline in earnings accelerated to -19.5%, while sales were down -2.3%. The company’s margin profile is healthy; over the last twelve months, Net Income was 10.3%, but declined somewhat to 8.7% in the most recent quarter.
Free Cash Flow: HRL’s free cash flow was a little over $810 million over the past twelve months and translates to a modest Free Cash Flow Yield of 3.67%.
Dividend Yield: HRL’s dividend is $.84 per share, and translate to a yield of 2.04% at its current price.
Debt to Equity: HRL has a debt/equity ratio of .04. This is a very low number that is clearly representative of the company’s conservative use of leverage and its approach to debt management. In the last quarter, HRL’s balance sheet showed a little over $574 million in cash and liquid assets against $250 million in long-term debt.
Price/Book Ratio: there are a lot of ways to measure how much a stock should be worth; but one of the simplest methods that I like uses the stock’s Book Value, which for HRL is $11 per share. At the stock’s current price, that translates to a Price/Book ratio of 3.72. The stock’s historical Price/Book ratio is 4.34, which puts a long-term target price at almost $48 per share.
Technical Profile
Here’s a look at the stock’s latest technical chart.
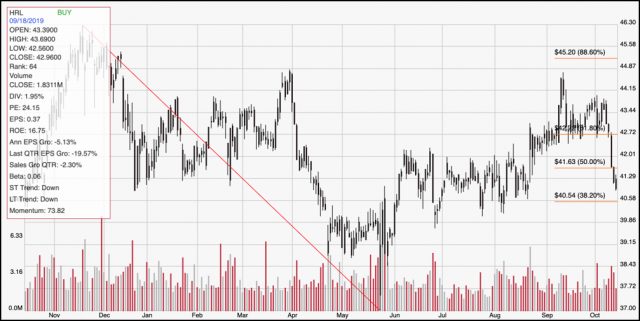
Current Price Action/Trends and Pivots: This chart traces the stock’s movement over the last year. The diagonal red line traces the stock’s downward trend from November 2018 to its bottom in early June; it also acts as the baseline for the Fibonacci retracement lines shown on the right side of the chart. The upward trend from that low pushed the stock to a peak in early September at around $44 per share, but in the last week or so bearish momentum has pushed the stock from a consolidation range near to $43 per share to its current price a little above $41. Near-term support is likely to be around $40.50, where the 38.2% retracement sits. If the stock bounces off of that level and moves higher, it’s short-term momentum could see the stock rally to a near-term high around $45, while a drop below that point could see the stock retest its trend low in the $37 price range.
Near-term Keys: HRL’s value proposition is interesting, but not quite compelling at the stock’s current price. Even so, I think the stock represents an interesting opportunity under current market conditions, and with about 16% of long-term upside, it could be a better opportunity than a lot of other areas of the market might offer if conditions remain volatile or, worse, turn even more bearish than they have been. If you prefer to work with short-term strategies, the stock’s current momentum makes a bullish signal unlikely; however if you see a swing low pivot, followed by a bounce off of support around $40.50, and you don’t mind being aggressive, there could an opportunity to buy the stock or work with call options with a short-term peak at around $45. A break below $40.50, however, could act as a signal to consider shorting the stock or to work with put options with a target price in the $37 price area.