For nearly the past year and a half, the Technology sector has been one of the volatile areas of the economy to try to follow, as tariffs and trade tensions have rocked stocks in practically every industry within the sector to some extent or another. Despite that volatility, a number of those stocks have performed quite well year to date, even when you factor in uncertainty that has weighed on the sector for the past couple of months.
A partial trade deal, reached last week between the United States and China seems to be giving the market reason to hope for better things in the near future. If continued progress on trade can be made, it’s reasonable to suggest that Technology stocks in general should benefit; most have recently been including conversations about trade in their corporate earnings reports and its negative impact on their results, and so any kind of easing, or even (in the best-case, “blue sky” scenario) elimination of existing tariffs should help tech companies regain some of the ground that the trade war has cost them. That would give investors even more reason to extend a bull market that is already the longest in recorded history.
While it’s been at least a generation since Xerox Corporation (XRX) could claim a spot as a power player in the Tech world, they’ve never lost their relevance. Even now they continue to not merely survive, but to succeed and prosper by sticking to what they do best. That’s part of the reason the stock is up nearly 50% since the beginning of 2019. At the same time, concerns about trade have played its role in its stock price, especially since its last earnings report at the end of July. The market used management’s forward commentary to push the stock from a multi-year high at nearly $37 to a September low at nearly $27. The stock is currently just a little above that low, which means it’s sitting -19.2% below that $37 high.
Does the hope of continued progress on the trade front mean that XRX could turn back to the upside and revisit its high around $37, or possibly even go higher? Maybe. The company has some very interesting fundamental strengths working in its favor, and a value proposition that offers an interesting, if debatable argument. Let’s look at the numbers so you can decide for yourself.
Fundamental and Value Profile
Xerox Corporation is a provider of digital print technology and related solutions. The Company has capabilities in imaging and printing, data analytics, and the development of secure and automated solutions to help customers improve productivity. The Company’s primary offerings span three main areas: Managed Document Services, Workplace Solutions and Graphic Communications. Its Managed Document Services offerings help customers, ranging from small businesses to global enterprises, optimize their printing and related document workflow and business processes. Managed Document Services includes the document outsourcing business, as well as a set of communication and marketing solutions. The Company’s Workplace Solutions and Graphic Communications products and solutions support the work processes of its customers by providing them with printing and communications infrastructure. XRX’s current market cap is about $6.7 billion.
Earnings and Sales Growth: Over the last twelve months, earnings increased almost 24%, while sales decreased by -8.8%. In the last quarter, earnings improved by about 8.8% while revenues increased by 3.79%. XRX operates with an adequate, but strengthening margin profile; Net Income versus Revenues over the past year was 5.75%, but increased in the last quarter to 7.9%.
Free Cash Flow: XRX’s free cash flow is healthy, at a little more than $1.12 billion. That translates to an attractive Free Cash Flow Yield of 17%. It is also worth noting that XRX’s Free Cash Flow was $0 in June of 2018.
Debt to Equity: XRX has a debt/equity ratio of .79. That’s generally a conservative number that reflects management’s approach to debt management. Since the beginning of 2018, the company’s long-term debt has decreased from a little more than $5.2 billion to its current level of $3.9 billion. Their balance sheet also shows $712 million in cash and liquid assets.
Dividend: XRX pays a dividend of $1.00 per share, which translates to an annual yield of 3.38% at the stock’s current price.
Price/Book Ratio: there are a lot of ways to measure how much a stock should be worth; but one of the simplest methods that I like uses the stock’s Book Value, which for XRX is $22.22, and which translates to a Price/Book ratio of 1.33 at the stock’s current price. The stock’s historical average Price/Book ratio is 1.205, which means the stock is a bit overvalued, by about -9.45%. Given the generally positive, and improving fundamentals I just outlined, however, I’m a little more inclined to lean on XRX’s Price/Cash Flow ratio, which is currently about 59% below its historical average. That puts the stock’s long-term target price at around $47 per share.
Technical Profile
Here’s a look at the stock’s latest technical chart.
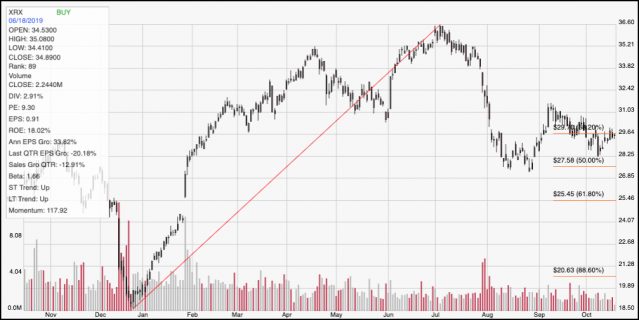
Current Price Action/Trends and Pivots: The diagonal red line traces the stock’s upward trend from the end of 2018 to the beginning of July of this year, from a low point at about $18.50 it reached a peak at about $36.50 per share. It also provides the baseline used to calculate the Fibonacci retracement lines shown on the right side of the chart. From its July high, the stock retraced back to a low at around $27 in mid-August, right on the 50% Fibonacci retracement line. A short-term rally then peaked at $31 before the stock dropped back to a bit above $28 per share about a week ago before pivoting back up to its current level a bit below the 38.2% retracement line, which is near $30 per share. A push above that line would be interesting, but in order to resume the stock’s upward trend, it would need to pushed above its $31 September peak. If that happens, the stock could push to as high as about $25 before finding its next resistance. A drop below the 50% retracement line at around $27 should see the stock test its next support around $25.50 where the 61.8% retracement line rests, with a big gap between $25.50 to its next most likely support around $20.50.
Near-term Keys: XRX is a stock with a solid fundamental profile, and a very interesting value proposition. That could make the stock a useful long-term value position – assuming you are willing to accept that the stock could see near-term downside into the mid-$20 range pretty easily if broader, bearish market pressures come back into play. If you are an aggressive, short-term trader, there could be an interesting bullish opportunity from a break above $31; that could be a good signal to buy the stock or to work with call options. If you prefer to work the bearish side, a drop below $27 could be an excellent signal to short the stock or consider working with put options, with an eye on the stock’s next pivot low, and 50% retracement line at around $25.50 as a very near-term target price.