It’s always been interesting to me, up to a point, to note how practically all of the talking heads on popular media seem to focus almost exclusively on growth-driven investing strategies. Not that it’s surprising – after all, they’re generally trying to play to the broadest possible market, which means they need to emphasize strategies that the greatest number of people are going to be interested in. The truth is that basic growth investing is a lot easier to talk about; after all, the shortest distance between two points is a straight line, and growth investing deals with a relatively simple, straight-line concept: will the stock be worth more down the road than it is today? More detailed questions get brushed aside in favor of data that favors a reasonable analysis that answers that question.
I’m not saying that growth investing is flawed, or that it doesn’t factor other important elements, like fundamental analysis or price action into it. The problem, however that I have with it is that the basic concept – buy the stock at a lower price than it will be sometime down the road – doesn’t encourage average investors to drill down into much more detail. That’s one of the reasons over the years that I’ve come to favor value-driven strategies; it’s not just about whether I think the stock could be worth more at some point in the future, but also about whether the stock is actually trading at a discount, right now, to where my analysis says the stock should be. That question requires a more detailed look not only at the fundamentals of a stock’s business, but also at how that business translates into a useful market price for investors like you and me. It requires a thoughtful consideration of where the stock’s price is today and what are the forces that have put the stock at that level.
The energy sector, and stocks in the oil industry in particular is one of the most volatile areas in the market. For evidence, you really don’t need to look any further than the price of oil itself; since topping out at around $66.50 per barrel in April of this year, West Texas Intermediate crude has dropped a little over -16% as of this writing. The price is also now just almost 30% below its 2018 peak in October at nearly $77 per barrel. The volatility in crude has pushed that commodity’s price as low as $42, and which has in turn wreaked havoc on stocks in that industry, especially on companies like Marathon Oil Corp (MRO) whose focus is on the exploration & production of crude oil, natural gas, and other energy resources. Free cash flow levels for these kinds of companies surge the most when oil prices are rising, which means that the commodity’s volatility for most of the past year has put a lot of pressure on the entire industry’s cash flows. That’s why it probably isn’t all that surprising that MRO’s stock price, like a lot of stocks in the industry, is not too far from its 52-week lows right now; in fact, the stock is down almost -35% since hitting its highest point this year at almost $19 per share.
A lot of investors are nervous about trying to work with this industry, and the entire energy sector right now because of the volatility I just mentioned. There are some important factors that I think actually make this an industry a smart investor should start paying more attention to. One of the drags on the industry going into the end of 2018, and that is still playing a role in the U.S. is the fact that pipeline capacity out of critical areas like the Permian Basin, cannot currently keep up with the pace of shale oil production. That has limited the ability of producers like MRO to get product out of the area, which has kept a massive amount of inventory at the beginning of the supply chain. There are a number of projects underway to add capacity that are expected to come online this year and into 2020, however, and that should mean that as capacity catches up with production, these companies should start to see improving cash flows. MRO stands above many of its competitive brethren, however because despite the pressures I just mentioned, their fundamental profile remains strong. This is also a multinational company that has been deleveraging its overseas operations, with 95% of its 2019 capital spending budget focused on U.S. shale projects, in the Permian Basin as well as the Eagle Ford and Bakken areas. They also have relatively limited exposure to the congestion problems I referred to earlier, because only about 4% of their current production comes from the Permian. Most industry experts expect crude to stabilize in the $66 to $70 per barrel price range through the next year, and if that happens, MRO should see significant improvements in their cash flows. With all of those elements combined, this looks like a stock with a very compelling long-term value proposition.
Fundamental and Value Profile
Marathon Oil Corporation is an exploration and production (E&P) company. The Company operates through two segments: United States E&P and International E&P. The United States E&P segment explores for, produces and markets crude oil and condensate, natural gas liquids (NGLs) and natural gas in the United States. The International E&P segment explores for, produces and markets crude oil and condensate, NGLs and natural gas outside of the United States, and produces and markets products manufactured from natural gas, such as liquefied natural gas (LNG) and methanol, in Equatorial Guinea (E.G.). MRO’s current market cap is about $9.6 billion.
Earnings and Sales Growth: Over the last twelve months, earnings increased 53%, while sales were mostly flat, but positive by a little over 1% – a reflection of the drop in oil prices over the last nine months. In the last quarter, earnings declined almost -26% while revenues increased by nearly 20%. MRO operates with a healthy, but narrowing margin profile; Net Income versus Revenues over the past year was 17.8%, and decreased in the last quarter to 11.6%.
Free Cash Flow: MRO’s free cash flow over the last twelve month is healthy, at a little more than $710 million. It is worth noting that this number was just $479 million in June of this year. That translates to a Free Cash Flow Yield of 7.37%.
Debt to Equity: MRO has a debt/equity ratio of .41. This is a conservative number that speaks to management’s ability to use debt more effectively than a lot of competitors in the industry. In the last quarter, MRO’s balance sheet reported more than $761 million in cash and liquid assets with about $4.9 billion in long-term debt. Given their healthy operating margin and increasing cash flows even amidst significant price pressures, along with generally good liquidity, effective debt management should continue to be a strength.
Dividend: MRO pays a dividend of $.20 per share, which translates to an annual yield of about 1.67% at the stock’s current price.
Price/Book Ratio: there are a lot of ways to measure how much a stock should be worth; but one of the simplest methods that I like uses the stock’s Book Value, which for MRO is $14.80, and which translates to a Price/Book ratio of .80 at the stock’s current price. The stock’s historical average Price/Book ratio is .87, which means the stock is undervalued, but only by about 7.8% based on this metric alone. That doesn’t scream bargain; but the stock is also currently trading more than 96% below its historical Price/Cash Flow average, which provides a long-term target price at about $23.50 per share. That’s a price level the stock hasn’t seen since October of 2018, and which makes the stock very interesting indeed.
Technical Profile
Here’s a look at the stock’s latest technical chart.
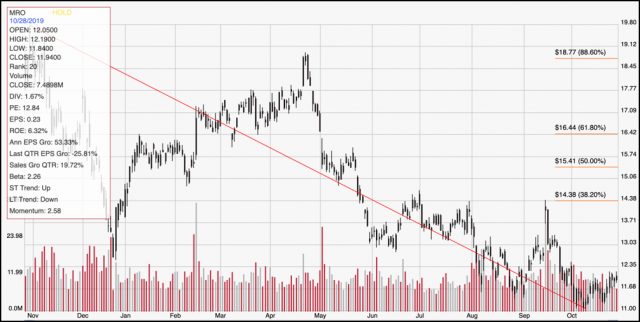
Current Price Action/Trends and Pivots: The diagonal red line traces the stock’s downward trend over the past year; it also informs the Fibonacci retracement lines shown on the right side of the chart. The stock has been showing some encouraging strength since the beginning of October, rebounding off of a trend low point at around $11 to its current price just a little below $12 per share. Immediate resistance is expected to be seen between $13 and $13.50 based on pivot highs in the middle of September; but if the stock can maintain its bullish momentum and break above that level, it could have attractive momentum to drive to about $14.50 per share where the 38.2% Fibonacci retracement line rests. If the stock picks up bearish momentum and breaks below trend low support at $11, the stock could drop to as low as $9 based on price levels last seen at the end of 2016.
Near-term Keys: MRO is a stock with a solid fundamental profile, and the fact that Free Cash Flow has shown significant improvement over the last quarter is very encouraging; along with Net Income that has remained relatively stable, I take it as a sign of management’s discipline and ability to manage expenditures. It isn’t a given the stock is going to continue to rebound, of course, which means that if you are going to make a value-based bet on the stock, you do need to be prepared for the stock to remain volatile in the short-term, and plan to hold for the long-term. If the stock does show signs of maintaining its current momentum, there could be a good opportunity to buy the stock or work with call options for a short-term trade with an eye on $14.50 as an exit target. A drop below $11, on the other hand would be an interesting signal to consider shorting the stock or to buy put options with an eye on $9 for a bearish trading target.