One of the most interesting sectors in the market right now, in my opinion is the Energy Sector. It’s proven to be pretty sensitive to trade pressures, like most sectors in the market; but progress towards compromise between the U.S. and China appears to be on track for an expected meeting between President Trump and Chinese President Xi next month that many hope will mark Phase One of a long-term agreement. Other pressures have kept oil prices from rising to levels many expected them to be at by now; for one, production cuts from OPEC on Brent crude haven’t had their expected effect, as reports indicate that many countries in the Middle East, including Iraq and Nigeria aren’t complying with those OPEC-imposed limits. In addition, supply of U.S. oil remains high, which adds to pressure on foreign oil. That probably the biggest reason that the sector is down about -13% since April.
Lower crude prices are usually a good thing for companies further along the supply chain from the point of exploration and production; for example, for refiners, lower crude usually means reduced costs, which helps to improve operating margins. That’s a good thing for refining stocks like HollyFrontier Corporation (HFC), a mid-cap, independent refining company with operations primarily in the Midwest and Western United States that I’ve followed for some time.
Many of the broad sector pressures of the past year and a half have had a negative, rippling effect on HFC; since June of 2018, the stock is well below its all-time high at around $83 per share. That decline, however doesn’t change the fact that the stock has also rebounded strongly over the past three months from a multi-year low around $38 to its current level a little above $54. That’s a 43.5% gain in that period – high enough, and in a short enough period of time that many investors might start to get nervous and wonder if the stock run, good while it lasted, is done. In fact, the stock is down almost -7% since the last week of October. Is that just a temporary pause, a technical pull back of the stock’s new upward trend, or is it a sign of increasing downside risk in the stock? From a fundamental and value-oriented standpoint, where does the stock stand? Let’s find out.
Fundamental and Value Profile
HollyFrontier Corporation is an independent petroleum refiner. The Company produces various light products, such as gasoline, diesel fuel, jet fuel, specialty lubricant products, and specialty and modified asphalt. It segments include Refining and Holly Energy Partners, L.P. (HEP). The Refining segment includes the operations of the Company’s El Dorado, Kansas (the El Dorado Refinery); refinery facilities located in Tulsa, Oklahoma (collectively, the Tulsa Refineries); a refinery in Artesia, New Mexico that is operated in conjunction with crude oil distillation and vacuum distillation and other facilities situated 65 miles away in Lovington, New Mexico (collectively, the Navajo Refinery); refinery located in Cheyenne, Wyoming (the Cheyenne Refinery); a refinery in Woods Cross, Utah (the Woods Cross Refinery), and HollyFrontier Asphalt Company (HFC Asphalt). The HEP segment involves all of the operations of HEP. HEP is a limited partnership, which owns and operates logistic assets. HFC has a current market cap of about $8.7 billion.
Earnings and Sales Growth: Over the last twelve months, earnings decreased by more than -15%, while revenues declined about -7.25%. in the last quarter, the decline in earnings accelerated, to almost -23% while sales dropped nearly -7.5%. The company’s margin profile improved in the last quarter, with Net Income as a percentage of Revenues in the last quarter at 5.91% versus 4.89% over the last twelve months.
Free Cash Flow: HFC’s free cash flow is healthy, at $1.5 billion, and marks an improvement from around $1.1 million at the beginning of the year. That translates to a very attractive Free Cash Flow Yield of 17.6%.
Debt to Equity: HFC’s debt to equity is .43, which is generally considered a conservative number. The company’s balance sheet indicates operating profits should be adequate to service their debt, and it also indicates the company’s liquidity is healthy, with more than $914 million in the last quarter versus about $2.78 billion of long-term debt. It’s worth noting that at the beginning of 2019, HFC reported just $496 million in cash, which makes the latest number all the more impressive.
Dividend: HFC’s annual divided is $1.32 per share, which translates to a yield of about 2.44% at the stock’s current price.
Price/Book Ratio: there are a lot of ways to measure how much a stock should be worth; but one of the simplest methods that I like uses the stock’s Book Value, which for HFC is $40.53 and translates to a Price/Book ratio of 1.33. The stock’s historical average Price/Book ratio is 1.42, which puts the stock’s long-term target price at about $57.50 per share. That puts the stock only about 6% below its projected long-term target price, which isn’t all that impressive; however, the stock is also trading more than 52.4% below its historical Price/Cash Flow ratio, and offers up a far more attractive target price near to the stock’s highs from last year at around $82.50.
Technical Profile
Here’s a look at the stock’s latest technical chart.
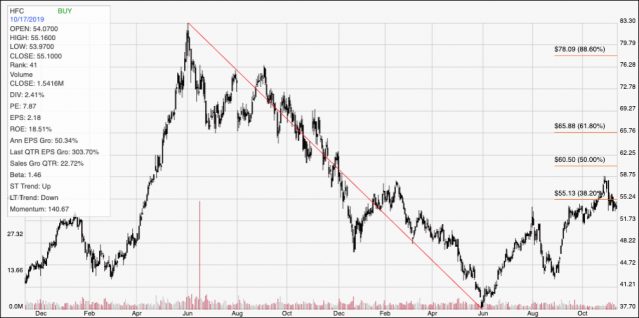
Current Price Action/Trends and Pivots: The chart above covers the last two years of price activity. The red line traces the stock’s downward trend from June 2018 to its low point in June at around $38; it also provides the baseline for the Fibonacci retracement lines shown on the right side of the chart. HFC has developed an impressive, intermediate-term upward trend since that June bottom, and is currently a little below the 38.2% Fibonacci retracement line at around $55 per share. Immediate resistance is around $58, based on the stock’s last pivot high at the end of October, and support is around $52. A break above resistance should give the stock good momentum to drive to a near-term target around $62.25 based on previous pivot points in October and November of 2018, and possibly to as high as the 61.8% retracement line at around $66 if bullish momentum holds after that. If the stock drops below current support around $52, look for the next support level to be in the $48 range based on previous pivots in that area in December of 2018 and again in March of this year.
Near-term Keys: Given the strength of the stock’s current bullish momentum, I think there is a stronger likelihood the stock should pivot off support around $52 and drive higher. That would act as a strong signal to buy the stock, or to buy call options, with an eye on $58 as a very short-term price target. A drop below $52, on the other hand could be an excellent signal to consider shorting the stock or working with put options, with a bearish target around $48. Despite the stock’s strong price performance since June, HFC’s fundamental strength, along with its Price/Cash Flow ratio suggests the stock remains an intriguing value opportunity; you could also treat any sign of continued bullish momentum as a good confirmation of the stock’s long-term prospects.