One of the big challenges any business, in any industry faces is the ability to remain relevant. There isn’t a single aspect of the economy that isn’t impacted by the progress of science and technology, and that means that what a business is doing today will change. That change could simply affect the way a company does business, or it could be about the entire business itself.
The Communication Services and Media industry is a good example of what I mean. Broadcast television, including cable and satellite programming have been one of the primary methods for keeping consumers connected and informed about the world around us for decades; but over the last decade or so, more and more consumers have begun “cutting the cord” as Internet bandwidth increased and made it easier and easier to get the same content and information via the Web. That is the reason that streaming services like Netflix, Amazon Prime, Disney+ and more are becoming more and more prevalent.
The rise in business of streaming services has put an increasing amount of pressure on companies in Broadcasting companies. For many investors, these companies represent the “old guard” of media services, while streaming companies are the wave of the future. That means that well-known names like Time Warner, DirecTV, DISH Network (DISH) and others have been forced to scramble to find ways to survive. Time Warner and DirecTV chose to merge with telecommunications company AT&T (T), while DISH is betting on its transformation to a 5G infrastructure company to secure its long-term future.
Smaller players in broadcast media face the same challenge, and the choices they make to face it are just as interesting to watch and analyze. Sinclair Broadcast Group, Inc. (SBGI) is a small-cap stock in the same industry with a conservative approach to financial management that has resulted in an impressive overall fundamental profile, but that has also shown a willingness to invest aggressively for what it believes are the right kinds of opportunities. Over the last few years, those have included acquisition of local and regional stations and services, with a particular focus on sports programming. In 2019, that focus has included a large, $10 billion acquisition of 21 regional sports networks from Disney (DIS), along with a joint venture agreement with the Chicago Cubs for their own sports network. After peaking in May of this year at around $66.50 per share, the stock has staged a clear, extended downward trend, with the stock more than -54% lower and sitting just a little above $30.50 per share as of this writing. The question is whether the company’s strategy puts them in a long-term position that offers investors a reason to take advantage of the stock’s large value proposition, or is this just another example of a company that is doomed to die a long, slow death as it fades into obscurity? Let’s run the numbers.
Fundamental and Value Profile
Sinclair Broadcast Group, Inc. is a television broadcasting company. The Company focuses on providing content on its local television stations and digital platforms. The Company’s segments are broadcast, other and corporate. The Broadcast segment consists of its broadcast television stations. The content distributed through its broadcast platform consists of programming provided by third-party networks and syndicators, local news, it owns networks, and other original programming produced by it. It also owns digital and Internet media products that are complementary to its portfolio of television station related digital properties. It focuses on offering marketing solutions to advertisers. Its other business consists of original networks and content, digital and Internet solutions, technical services and other non-media investments. SBGI has a current market cap of about $2.8 billion.
Earnings and Sales Growth: Over the last twelve months, earnings increased by 85.48%, while revenues grew by almost 47%. In the last quarter, earnings improved almost 64.29% while sales rose almost 46%. Growing earnings faster than sales is difficult to do, and while it generally isn’t sustainable in the long term, it is also a mark of management’s ability to maximize business operations. The company’s margin profile could be problematic; in the last year, Net Income was 5.98% of Revenues, but in the last quarters turned negative by -5.3%. The dramatic shift can be attributed at least in part to its late-year deal with Disney, and if the integration of the RSN’s they acquired from the transaction proceeds as expected, the deteriorating margin profile shown by its current Net Income should be a temporary anomaly.
Free Cash Flow: SBGI’s free cash flow is healthy and improving at $645.8 million over the last twelve months; it was a little under $500 million in June of this year. That translates to a Free Cash Flow Yield of 23%.
Debt to Equity: SBGI’s debt to equity is 7.53, which is a very high number. It jumped from 2.59 in the last quarter, reflected by the Disney RSN acquisition, which was accomplished primarily through debt. Their balance sheet shows $1.4 billion in cash and liquid assets against $12.6 billion in long-term debt. Liquidity is a concern, and it bears watching in the quarters ahead to see if the company can use its new business to grow earnings and pay down debt even further.
Dividend: SBGI’s annual divided is $.80 per share, which translates to a yield of about 3.59% at the stock’s current price.
Price/Book Ratio: there are a lot of ways to measure how much a stock should be worth; but one of the simplest methods that I like uses the stock’s Book Value, which for SBGI is $64.79. That means that the stock’s Price/Book ratio is 1.67. Their historical Price/Book ratio is 4.73, which suggests that the stock is undervalued by more than 100% right now. By contrast, however the stock is trading about 76% above its historical Price/Cash Flow ratio. That offers a more conservative, but still very interesting long-term target at around $53.50 per share.
Technical Profile
Here’s a look at the stock’s latest technical chart.
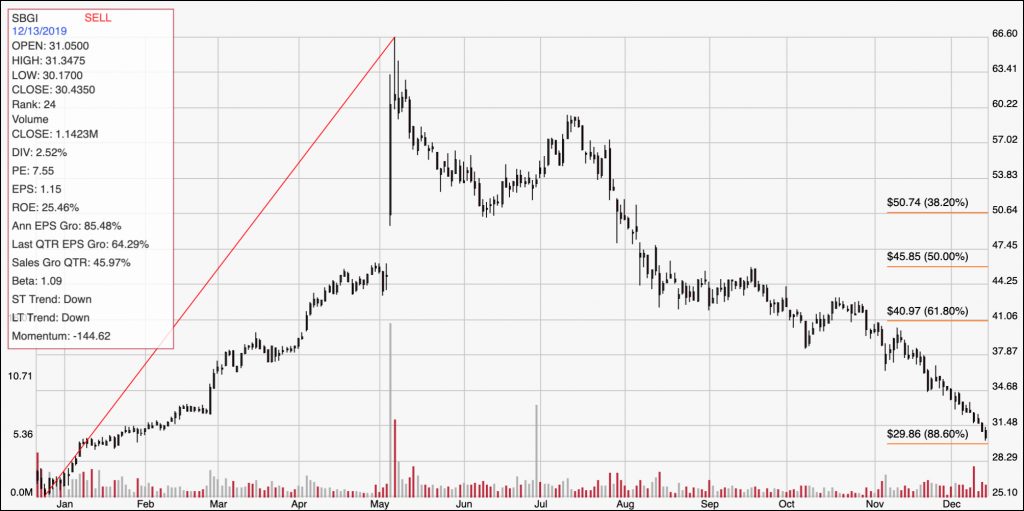
Current Price Action/Trends and Pivots: The chart above covers the last year of price activity. The red diagonal line traces the stock’s upward trend beginning in late December of last year to its peak at around $63.60 per share in May. From that point, however the stock has dropped into an extended, downward trend that has seen the stock’s bearish momentum push the stock to its current level around $30.50 per share. Support is a little below $30 where the 88.6% Fibonacci retracement line sits. If the stock can rebound from that level and move higher, it should have room to rally to a near-term peak at around $38 per share; but if it drops below $30, it should drop enough to test the next support at its 52-week low around $25 per share.
Near-term Keys: If you work off of the basis of the stock’s Price/Book ratio, SBGI carries a compelling value argument. Projecting a long-term target price above $90 per share is over-optimistic in my view, given that the stock’s all-time high was reached in May of this year at just about $65; however that peak, along with the stock’s Price/Cash Flow ratio does offer an interesting opportunity if you’re willing to be patient with a stock that has a mostly solid fundamental basis. From a short-term standpoint, a bounce off of support at $30 could offer an interesting short-term bullish trade using the stock itself or call options, with a short-term target at around $38 per share. A push below $30 should see the stock drop to about $25, with room to test its 52-week low point around $25 if bearish momentum continues; that could offer a useful opportunity to short the stock or to buy put options.