Coming up on the end of the year, it’s easy to look at the stock market’s strong performance through the year, and positive news about trade, interest rates and geopolitics like Brexit and say that the market should be poised for another strong year in 2020. And that might be true; it is also true, however that the market is poised to move into year 11 of an unprecedented period of growth. That should naturally make even the most enthusiastically bullish investor start to wonder how much longer the upward run can last.
Consumer Staples is a sector I’ve used for a long time to find investments that I think offer a more conservative, defensive posture in periods where I think downside risk in the market could be increasing. Seeing more and more analysts and investors turning bullish at the extreme high end of a bull market is a good example of what I think characterizes those kinds of periods, and it’s I like stocks in this sector right now. That includes stocks in the Food industry in particular.
Cal-Main Foods, Inc. (CALM) is an interesting example that by most considerations should look attractive right now as a bullish investment. The stock is down about -20% since July 2018, but has also rallied about 13% higher since the beginning of October, which means it appears to be picking up bullish momentum with a solid short-term upward trend behind it. Is it also a good value, with the fundamentals behind it to back it up? Let’s find out.
Fundamental and Value Profile
Cal-Maine Foods, Inc. is a producer and marketer of shell eggs in the United States. The Company operates through the segment of production, grading, packaging, marketing and distribution of shell eggs. It offers shell eggs, including specialty and non-specialty eggs. It classifies cage free, organic and brown eggs as specialty products. It classifies all other shell eggs as non-specialty products. The Company markets its specialty shell eggs under the brands, including Egg-Land’s Best, Land O’ Lakes, Farmhouse and 4-Grain. The Company, through Egg-Land’s Best, Inc. (EB), produces, markets and distributes Egg-Land’s Best and Land O’ Lakes branded eggs. It markets cage-free eggs under its Farmhouse brand and distributes them throughout southeast and southwest regions of the United States. It markets organic, wholesome, cage-free, vegetarian and omega-3 eggs under its 4-Grain brand. It also produces, markets and distributes private label specialty shell eggs to customers. CALM has a current market cap of about $2.1 billion.
Earnings and Sales Growth: Over the last twelve months, earnings declined significantly, by more than -438%, while revenues dropped by a little more than -29%. The picture isn’t really better in the last quarter, as earnings dropped by -114% while sales decreased by nearly -14%. The company’s margin profile is a major red flag and reflecting the deterioration I referred to, with Net Income as a percentage of Revenues in the last quarter at -18.9% versus -0.3% over the last twelve months.
Free Cash Flow: CALM’s free cash flow is negative, at -$46.37 million. That confirms the troubling signs from the stock’s Net Income; a year ago, Free Cash Flow was healthy, at almost $222 million.
Debt to Equity: CALM’s debt to equity is .0, which in this case doesn’t mean CALM has no debt, only that it is so small that it’s easier to leave the ratio at zero. Long-term debt was just $1.42 million in the last quarter, versus $236.09 million in cash and liquid assets. CALM has plenty of liquidity, but its declining operating profile means that it is also burning cash; at the beginning of 2019, their balance sheet showed $341.85 million in cash.
Dividend: CALM’s annual divided is $.85 per share, which translates to a yield of a little over 2.2% at the stock’s current price. For now, the company is being forced to draw from cash to maintain its dividend, which could call the safety of that dividend into question.
Price/Book Ratio: CALM’s Book Value is $19.38, which marks a decline from $20.70 at the beginning of the year. That means that the stock’s Price/Book ratio is 2.2 versus their historical Price/Book ratio of 2.55, which suggests that the stock is undervalued by about about 15% right now.
Technical Profile
Here’s a look at the stock’s latest technical chart.
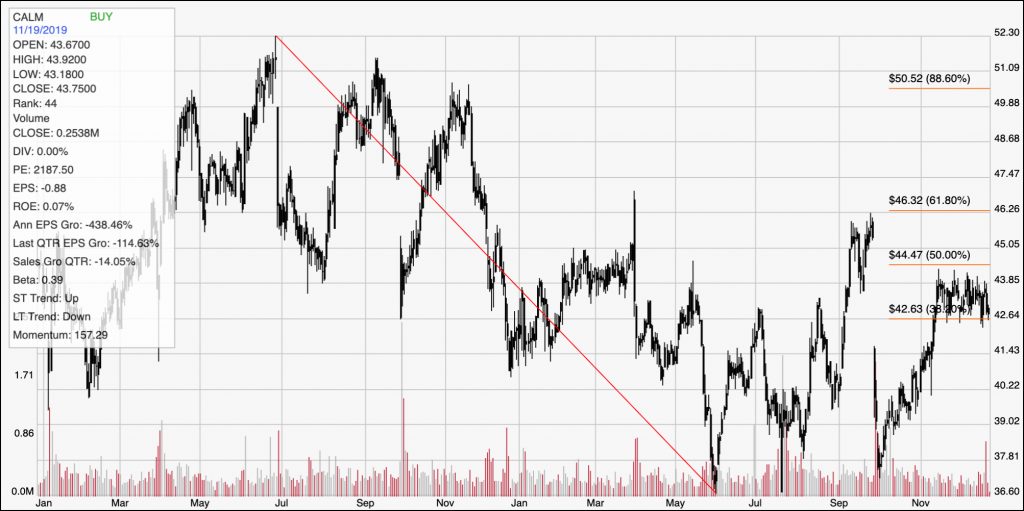
Current Price Action/Trends and Pivots: The diagonal red line traces the stock’s downward trend from November 2018 to June of this year, and provides the reference for calculating the Fibonacci retracement levels indicated by the horizontal red lines on the right side of the chart. The stock began to develop a nice upward trend in June on the back of a value profile that at the time was also backed by a generally favorable set of fundamental metrics; that puts the stock’s decline since late September into even sharper relief, as the market punished the stock severely following its third quarter earnings report. The stock finally found support not far from its 52-week and trend low point at around $36.50. From that point, the stock has rallied strongly, pushing above the 38.2% Fibonacci retracement line at around $42.50, which now defines the stock’s immediate support level. Near-term resistance is around $44.50, with $46.50 as shown by the 61.8% Fibonacci retracement line acting as a secondary level beyond that point. If the stock breaks below its current support at around $42.50, its next support is probably around $40.
Near-term Keys: The stock’s momentum is strongly bullish right now, but the stock’s fundamentals make a long-term bet on the company pretty shaky right now. The best probabilities lie with short term trades; a break above $42.50 could act as a good signal to buy the stock or work with call options with an eye on $44.50 as a quick-exit target point, while a drop below $42.50 could be a signal to think about shorting the stock or working with put options with an eye on $40 to close out a bearish trade.