One of the things I love about being an investor is the opportunity to talk to other investors. It’s certainly fun to share my own ideas about successful investing and my view of current economic conditions and events, but more importantly, I really like being able to compare notes, hear their ideas, and see how perspectives other than my own can help refine my own view of the markets and my own investing methods. I’ve found over the years that, while you can invest in this era without ever leaving your house, being a successful investor really isn’t a solitary effort. I’ve had much better success by being able to maintain contact with other investors and learn from their own great ideas.
Earlier this week, I had the opportunity to talk to another investor in the context I just outlined. We were talking about how to find good value when you think the market could be about to reverse, and the current, even more extended state of the bull market and current upward economic cycle. Our conversation turned to some of the biggest industrial players in the market – the companies that everybody recognizes and simply assumes are always going to be around. There are a couple of big names out there right now that, despite their easily recognizable names, decades-long reputations, and massive size, are going through major challenges and struggles.
Lately, one of the biggest companies in the world that has made a lot of headlines is Boeing Co (BA); the troubles that began with tragic, fatal crashes of their best-selling 737 Max airline have only increased as scrutiny on the plane has increased, casting enough doubt on the company’s fortunes that their CEO was forced to resign this week. Another name that is also undergoing massive change, but for an even longer period, is General Electric Co. (GE). That stock’s price has been plummeting since December 2016 as myriad troubles in its Power unit and other businesses also forced a CEO change and led the company to start selling off some of its businesses. The stock’s price has reflected the turmoil, dropping from a high point in December 2016 at around $32 to a low at the end of 2018 at around $6.50 per share.
2019 has treated shareholders in the stock a bit better, as management’s efforts to liquidate businesses to raise cash and improve its bottom line have resonated well with investors. The stock is up about 50% over the past year, but appears to have hit a plateau at around $11.50 in mid-November, and dropping a bit from that point this month. That begins to beg the question: is the worst over for what wasa , just about ten years ago, the largest capitalized company in the world? And if it isn’t, what price for the stock would represent a useful value. Let’s see if we can find out.
Fundamental and Value Profile
General Electric Company is a global digital industrial company. The Company’s products and services range from aircraft engines, power generation, and oil and gas production equipment to medical imaging, financing and industrial products. Its segments include Power, which includes products and services related to energy production; Renewable Energy, which offers renewable power sources; Oil & Gas, including liquefied natural gas and pipelines; Aviation, which includes commercial and military aircraft engines, and integrated digital components, among others; Healthcare, which provides healthcare technologies in medical imaging, digital solutions, patient monitoring and diagnostics, and drug discovery, among others; Transportation, which is a supplier to the railroad, mining, marine, stationary power and drilling industries; Energy Connections & Lighting, which includes Energy Connections and Lighting businesses, and Capital, which is a financial services division. GE has a current market cap of about $98.1 billion.
Earnings and Sales Growth: Over the last twelve months, earnings increased by a little over 7%, while revenues declined by -21%. In the last quarter, earnings dropped by -11.75% while sales decreased nearly 19%. The company’s margin profile is negative, and marks a major red flag; Net Income as a percentage of Revenues in the last quarter is -40.33% versus -4.38% over the last twelve months. This is a clear indication the company isn’t just paying out more than it’s bringing in; it is hemorrhaging cash and is the reason management continues to seek a buyer for Baker Hughes, sold the biopharmaceutical portion of its health care business to Danaher for $21.4 billion in cash, and has slashed its dividend to a token $0.01 per share quarterly level.
Free Cash Flow: GE’s free cash flow is $4.4 billion and translates to a Free Cash Flow Yield of 4.53%. This also marks a decline from the beginning of 2019 of about $20 billion on a trailing twelve-month basis.
Debt to Equity: GE’s debt to equity is 2.67, which is a high number, and marks the company as the most highly leveraged among Industrial Conglomerates. Their balance sheet shows $76 billion in cash and liquid assets versus $77.8 billion in long-term debt. That large cash position is a reflection of aggressive cost-cutting and divestitures, which are likely to give the company stability and an ability to ultimately ride through its difficulties; the question, however is how long that may take.
Dividend: GE’s annual divided is $.04 per share, which translates to a yield of about 0.36% at the stock’s current price. Despite the meager size of the dividend, it is nonetheless higher than their actual earnings per share over the last twelve months, meaning that they are paying the dividend entirely from available cash.
Price/Book Ratio: GE’s Book Value is $3.36, which translates to a Price/Book ratio of 3.36 versus their historical Price/Book ratio of 2.39, which suggests that the stock is overvalued by about about -29% right now. That puts the stock’s “fair value” at around $7.98, with its useful bargain price at just a little above $6 per share.
Technical Profile
Here’s a look at the stock’s latest technical chart.
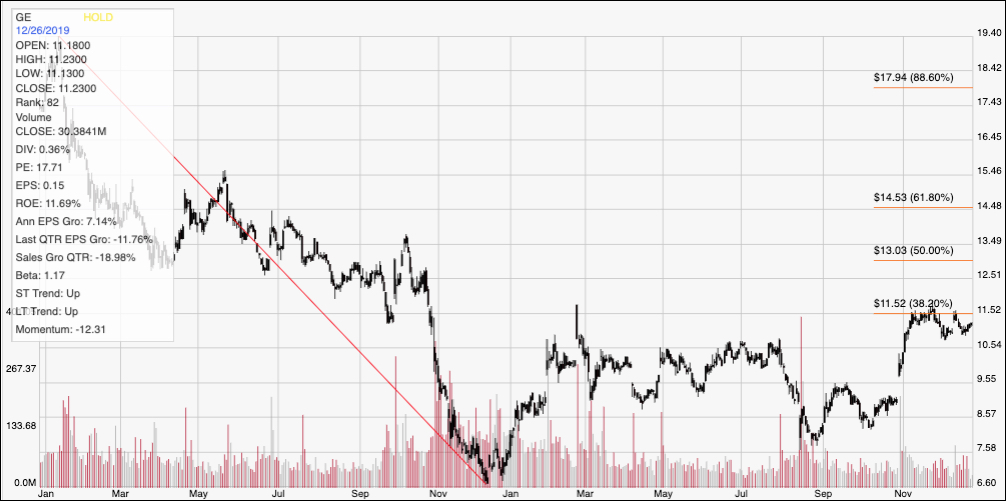
Current Price Action/Trends and Pivots: The diagonal red line traces the stock’s downward trend from January 2018 to a low point in December of last year, and provides the reference for calculating the Fibonacci retracement levels indicated by the horizontal red lines on the right side of the chart. At the end of October, the stock picked up quite a bit of bullish momentum, jumping from around $9 per share to $11.50 by mid-November, where the 38.2% Fibonacci retracement line sits. The stock has failed to penetrate that line, however, dropping back off of it on three separate occasions, including the most recent earlier this month. A push above $11.50 could see the stock rally strongly to between $13, where the 50% retracement line sits, and $13.50 per share share. Current support is between $10.50 and $11 per share; a drop below that point could see the stock drop quickly back near to its September peak, and next likely support at around $9.50 per share.
Near-term Keys: Despite its strong cash position, GE’s fundamentals are poor, and continuing to deteriorate; these are conditions that make any kind of bullish bet on the stock, over any time period extremely speculative. That said, if the stock can break above $11.50 and hold above that point, there could an opportunity to buy the stock or work with call options up to an exit target at around $13.50 per share. I think the strongest probability lies on the bearish side. If the stock drops below $11, you could consider that a good signal to consider shorting the stock or working with put options with an eye on a target price in that case at around $9.50 per share. GE is a stock I wouldn’t start to take seriously as a long-term, value-based investment unless the stock dropped back near to its multi-year lows around $6.50, and could start to see signs to material improvement in its fundamental metrics – starting with a positive reversal in Net Income.