Digging through the thousands of publicly traded companies on U.S. stock exchanges, looking for value is something that can get tougher the longer a bull market lasts. That’s especially true for sectors and industries that have been leading the broad market’s trend. The Financial sector is a good example; as measured by the S&P 500 Financials Sector SPDR ETF (XLF), financial stocks are up more than 30% over the past year and about 1.7% in the past month. That puts Financials among the best-performing sectors in the entire market.
If you follow a contrarian, value-focused approach to sifting through the market for investing opportunities, market leaders like Financials generally aren’t the kinds of sectors you naturally gravitate to; in fact, by default such a strong, long-term performance practically mandates that contrarians like myself automatically discount any practical opportunity stocks in the sector might offer.
The caveat to that guideline, however is the reality that even in the best-performing sectors, there are always stocks that diverge from the broader pattern. Employee Holdings Inc. (EIG) is a good example; this is a small-cap company in the Financial sector with a very specific focus and market niche. Despite a solid financial and fundamental profile, the stock’s performance over the past year has been uninspiring; the stock has basically tread water, up only 1.14%. It’s also down a little over -3% over the last month. Is that enough, along with the good fundamentals, to mark the stock as a good value opportunity you should pay attention to? Here are the numbers; you decide.
Fundamental and Value Profile
Employers Holdings, Inc. is a holding company. Through its insurance subsidiaries, the Company provides workers’ compensation insurance coverage to select, small businesses in low to medium hazard industries. It provides workers’ compensation insurance under a statutory system wherein employers are required to provide coverage for their employees’ medical, disability, vocational rehabilitation, and/or death benefit costs for work-related injuries or illnesses. As of December 31, 2016 the Company provided workers’ compensation insurance in 36 states and the District of Columbia, with a concentration in California. Its insurance subsidiaries include Employers Insurance Company of Nevada (EICN), Employers Compensation Insurance Company (ECIC), Employers Preferred Insurance Company (EPIC) and Employers Assurance Company (EAC). The Company’s insurance products are jointly offered and marketed with and through its partners and alliances. EIG has a current market cap of about $98.1 billion.
Earnings and Sales Growth: Over the last twelve months, earnings declined by a little over-10%, while revenues declined by -13.3%. In the last quarter, earnings dropped by -2.2% while sales decreased nearly -3%. The company’s margin profile is very healthy; Net Income as a percentage of Revenues in the last quarter is 16.3%, which is just a little below the 18.7% it posted over the last twelve months.
Free Cash Flow: EIG’s free cash flow is $144 million and translates to a useful Free Cash Flow Yield of 10.7%.
Debt to Equity: EIG’s debt to equity is 0, meaning that the company has no long-term debt to speak of. Its liquidity is also improving; in March of this year, cash and liquid assets were about $95 million, and increased to nearly $145 in the last quarter.
Dividend: EIG’s annual divided is $.88 per share, which translates to a yield of about 2.11% at the stock’s current price.
Price/Book Ratio: EIG’s Book Value is $36.47, which translates to a Price/Book ratio of 1.14 versus their historical Price/Book ratio of 1.36, which suggests that the stock is undervalued by about about 36% right now. That puts the stock’s “fair value” at around $56.58, which is pretty attractive with the stock sitting a little below $42 right now.
Technical Profile
Here’s a look at the stock’s latest technical chart.
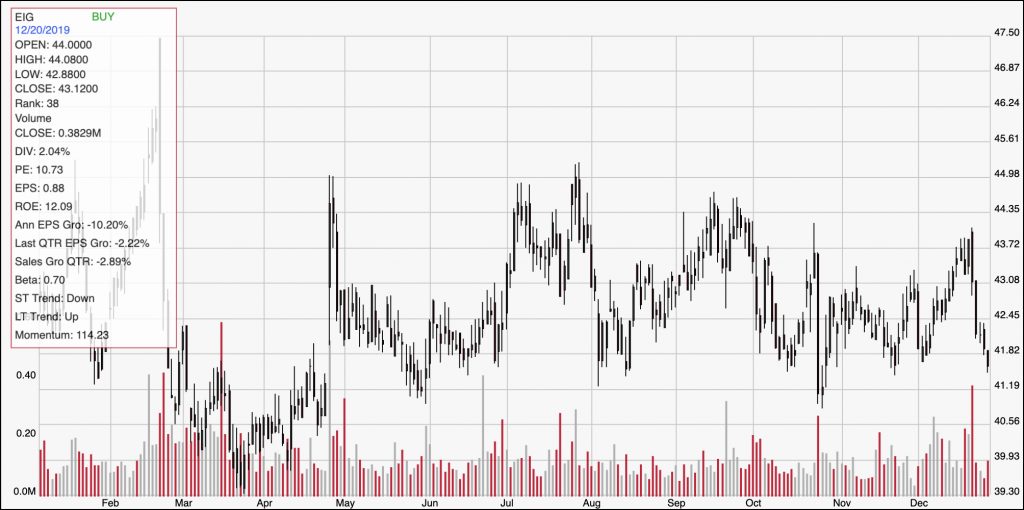
Current Price Action/Trends and Pivots: The chart above marks the last year of price activity for EIG. The stock has really followed a very sideways pattern for most of the year; the top of the stock’s trading range is also its most important resistance point at about $44 per share, while the stock is just a little above range support at $41 per share. A drop below that level could see the stock test its 52-week low price at around $39, while a break above $44 could give the stock bullish momentum to push near to its 52-week high at $48 in the short term.
Near-term Keys: EIG’s sideways price pattern is interesting for a short-term trader, as much because the pattern has persisted since May of this year. A drop below current support at $41 could offer an interesting opportunity to consider shorting the stock or working with put options, with an eye on the stock’s 52-week low around $39 per share. If you want to be very aggressive, a bounce off of that support level could be a signal to think about buying the stock or working with call options, with an eye on the top of the current trading range at $44; a break above $44 would be a strong indication bullish momentum is increasing, offering a target near the stock’s 52-week high at around $48. From a fundamental and value-based standpoint, EIG is an interesting stock; but the stock’s long sideways pattern does beg the usefulness of the stock as a long-term buying opportunity under current conditions. A technical break above $44, however would make the stock far more interesting, with a long-term target above $58 more reasonable to bet on in that case.