Looking out for value-based opportunities can be a little tough when the market is sitting at or near the top of an extended upward trend. That’s because a lot of the stocks that you’ve been following while the market was in the midst of that run to the top will often also be found pushing up to or very near to their own set of all-time highs. The argument that a lot of growth-focused analysts will make with these kinds of stocks is that not all rallies to those highs are created equal.
Earlier yesterday, I listened to a commentary on CNBC along these lines. The first example was the market’s push to all-time highs during the “dot-com Boom” of the late 1990’s. History has shown that a lot of the tech stocks that were turning a lot of day traders into paper millionaires during those years were being driven to those highs primarily by market sentiment and momentum that wanted to push those stocks higher – not by the underlying fundamental strength of the stocks themselves.
There is an interesting, different case to be made to the market’s latest rally. Corporate profits and revenues have mostly been coming in stronger than most analysts have predicted for most of the last year, while economic growth in the U.S. has increased at the kind of gradual, moderate pace that has led some economists to use the term “Goldilocks” to describe the U.S. economy – not too hot, and not too cold. It’s just right.
A similar logic can be applies on an individual stock basis. If the value of a stock’s underlying business is healthy and growing, there is generally a stronger case to made that a concurrent, and proportional increase in price is to be expected; also, that even if the stock is at or near all-time highs, the pattern of increasing intrinsic value could indicate the stock may continue to push higher. Trying to forecast where that stock might go is a bit harder when the stock is already at or near a top; but there are still other metrics that can be applied.
Paccar Inc. (PCAR) is a large-cap Industrial stock that has a number of fundamental strengths working in its favor right now. The name of the company might not be immediately familiar to you, but I’m willing to bet you’re used to seeing their Peterbilt and Kenworth heavy-duty highway trucks. The stock’s price performance correlates pretty closely with the market’s rally since the last quarter of 2019; from a low support point in August, the stock has rallied about 25% higher, but also dropped almost -10% in the last month. The real question is whether there is a case to be made that the stock could not only push back to its December, all-time high, or even higher? Let’s take a look.
Fundamental and Value Profile
PACCAR Inc (PACCAR) is a technology company. The Company’s segments include Truck, Parts and Financial Services. The Truck segment includes the design, manufacture and distribution of light-, medium- and heavy-duty commercial trucks. The Company’s trucks are marketed under the Kenworth, Peterbilt and DAF nameplates. It also manufactures engines, primarily for use in the Company’s trucks, at its facilities in Columbus, Mississippi; Eindhoven, the Netherlands, and Ponta Grossa, Brazil. The Parts segment includes the distribution of aftermarket parts for trucks and related commercial vehicles. The Financial Services segment includes finance and leasing products and services provided to customers and dealers. Its Other business includes the manufacturing and marketing of industrial winches. The Company operates in Australia and Brazil and sells trucks and parts to customers in Asia, Africa, Middle East and South America. PCAR has a current market cap of about $26.8 billion.
Earnings and Sales Growth: Over the last twelve months, earnings have increased almost 13%, while revenues improved about 10.5%. In the last quarter, earnings were a bit lower, by -1.69%, while revenues dropped almost -4%. The company’s margin profile is both solid and consistent: over the last twelve months, Net Income was 9.45% of Revenues, and improved somewhat to 9.54% in the last quarter.
Free Cash Flow: PCAR’s free cash flow is healthy at $1.63 billion over the last year. That translates to a useful Free Cash Flow Yield of 6.12%. It has also increased from about $1.5 billion since the middle of 2019.
Debt/Equity: The company’s Debt/Equity ratio is .67, reflecting a conservative approach to leverage. PCAR’s balance sheet shows $4.77 billion in cash and liquid assets in the last quarter versus about $6.7 billion in long-term debt. The company’s healthy operating profile, along with a solid cash position means that the company has good liquidity and should have no problems servicing the debt they have.
Dividend: PCAR’s annual divided is $1.28 per share and translates to a yield of about 1.66% at the stock’s current price.
Price/Book Ratio: there are a lot of ways to measure how much a stock should be worth; but one of the simplest methods that I like uses the stock’s Book Value, which for PCAR is $28.80 and translates to a Price/Book ratio of 2.69 at the stock’s current price. The stock’s historical average Price/Book ratio is 2.7, suggesting that the stock is level with its fair value. PCAR’s Price/Cash Flow is a little more optimistic since it is currently about 8.91% below its historical average, putting the top end of the stock’s upside potential at about $84.50 per share, right around its December high. By comparison, however, the industry average Price/Book ratio is 5.4; if the market’s current strength continues, and also continues to be driven by solid fundamental strength from companies like PCAR, a long-term target price at around $155 per share may not be unreasonable.
Technical Profile
Here’s a look at the stock’s latest technical chart.
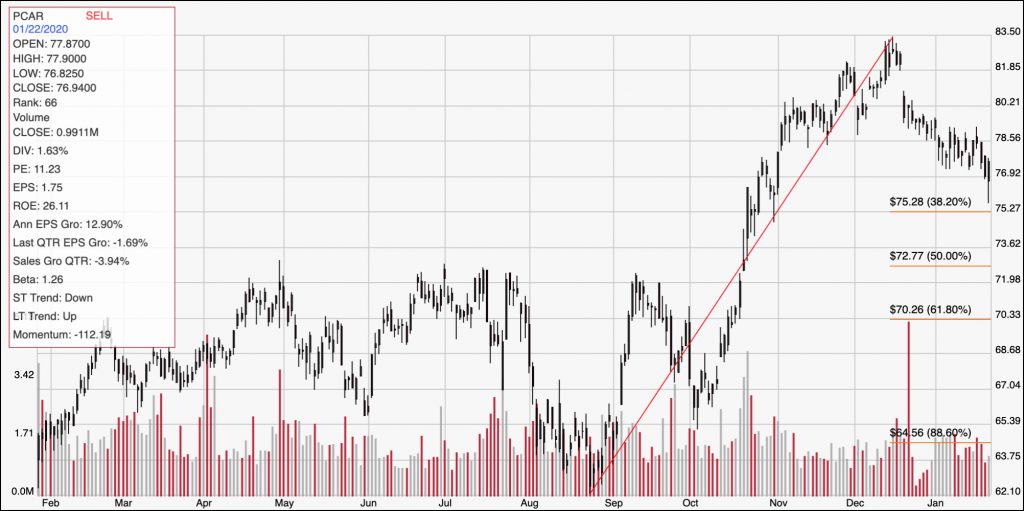
Current Price Action/Trends and Pivots: The chart above shows the last year of price activity for PCAR. The stock’s upward trend from September to December is easy to see, as is the pullback near to support at the 38.2% Fibonacci retracement line at around $75 per share. A bounce off of support could see the stock test nearest resistance around $80, with its December high around $83.50 not far off if momentum continues to be bullish. If the stock drops below $75, the short-term downward trend could possibly extend into an intermediate period of time, with its next support level around $72 per share based on pivot highs seen throughout 2019.
Near-term Keys: For the most part, I really like PCAR’s fundamentalsIs. Their balance sheet is among the strongest in their industry, and analysts are forecasting about 8% revenue growth in the next year, which is healthy. At the same time, I don’t think it would be wise to call PCAR a strong value right now. That doesn’t mean the stock doesn’t offer some opportunity, or even that the long-term opportunity has passed by. It does mean that I think long-term upside is more limited than I would be willing to work with for a value-based investment – despite the fact that the stock’s current Price/Book is less than 50% the industry average It also means that the best possibilities lie on the short-term side, via momentum-based trades. A bounce off of support anywhere between the stock’s current price and $75 could offer an interesting opportunity to buy the stock or work with put options with an eye on $80 to $83 as a useful profit target. If you don’t mind being somewhat aggressive, a break below current support to $75 might be a signal to consider working with put options, with a near-term target price at around $72.