It’s always interesting to watch the way market sentiment and investor attention shifts over time. Just a month ago, investors were talking about how long the economy was going to keep growing, especially as trade concerns receded, the Fed talked about maintaining growth, and consumer sentiment seemed high on the bullish side.
What a difference a month makes! Economists, analysts and investors alike try to look ahead and anticipate risks and pitfalls that may lie ahead; but I don’t think anybody thought that the “thing” that would actually propel stocks into a verifiable bear market was a virus. That’s probably why the initial end of any long, extended bull market always seems to come out of nowhere to most people. I think it’s also why the initial drop is almost invariably steep, marking both an accelerated pace as well as being exaggerated in size.
Watching the news right now can be pretty brutal. It doesn’t matter whether you’re looking for market news or just current events, everything right now is all about one thing. COVID-19, its spread and the sudden changes that it has forced on the world – and just in the last week, in the United States – have dominated the airwaves, the Web, and everything in between. Fear is really, really high, and that means that investors are selling on an increasingly exaggerated scale and running for the exits. We do seem to have stabilized a bit this week, and so we’ll see if the market can start to consolidate around its current level. If news reports don’t provide some hope that a useful treatment of COVID-19 is likely in the weeks or months ahead, though, don’t be surprised if the market keeps dropping.
That potential for greater weakness in the market is on the biggest reasons that I think it’s time to very cautious about taking new positions; do it only when you think the opportunity is too good to miss, and if you have an opportunity to be defensive right now, it’s a good idea to take it seriously. One of the ways that a lot of people like to get defensive – to find useful “safe haven” investments – is to work with precious metals like gold and silver. Working with the commodities themselves can be a good way to directly hedge against market risk. The Fed’s accommodative stance towards interest rates going into the end of the year, along with the drastic steps it took last week to slash rates to zero, should be a positive for metals like gold, which usually respond bullishly to lowering interest rates.
If you don’t want to work directly with the commodity itself, another alternative is to invest in the companies that mine, process, and produce it. Barrick Gold Corp (GOLD) is one of the largest gold miners in the world, with operations in Canada, the United States, Central and South America, and Australia. The stock saw a big increase in price since the beginning of June 2019 to the middle of February, rallying from a little below $12 a share to a high price just below $23 per share. Like most stocks in the Metals and Mining industry, it hasn’t been immune from the market’s volatility of the last couple of weeks; last week it plunged to a low around $14 before starting to stabilize right now around $16. Does that mean that GOLD is a company that could act as a good proxy? Let’s dig in and find out.
Fundamental and Value Profile
Barrick Gold Corp is a gold mining company. The Company is principally engaged in the production and sale of gold and copper, as well as related activities, such as exploration and mine development. The Company’s segments, include Barrick Nevada, Golden Sunlight, Hemlo, Jabal Sayid, Kalgoorlie, Lagunas Norte, Lumwana, Porgera, Pueblo Viejo, Turquoise Ridge, Veladero and Zaldvar. Pueblo Viejo, Lagunas Norte, Veladero and Turquoise Ridge are its individual gold mines. The Company, through its subsidiary Acacia, owns gold mines and exploration properties in Africa. Its Porgera and Kalgoorlie are gold mines. Zaldivar and Lumwana are copper mines. The Pascua-Lama project is located on the border between Chile and Argentina. The Company owns a number of producing gold mines, which are located in Canada, the United States, Peru, Argentina, Australia and the Dominican Republic. GOLD has a current market cap of about $29.3 billion.
Earnings and Sales Growth: Over the last twelve months, earnings have increased by more than 183%, while revenues improved about 51.5%. In the last quarter, earnings grew by 13.3%, and revenues rose 7.65%. The company’s margin profile is a sign of strength; over the last twelve months, Net Income was 40.8% of Revenues, and improved to 48.1% in the last quarter.
Free Cash Flow: GOLD’s free cash flow is modest at $1.17 billion over the last year, which is an impressive improvement from about $401 million at the beginning of 2019. That translates to a Free Cash Flow Yield of 4.1%. GOLD had a negative Free Cash Flow pattern until about a year ago, so this is not only a useful reversal sign, but also a good good indication of broader underlying fundamental strength.
Debt/Equity: The company’s Debt/Equity ratio is .17, reflecting a conservative approach to leverage. Their balance sheet, in fact is a point of strength, since cash and liquid assets have improved since the beginning of 2019 from $1.57 billion in January to $2.4 billion in the last quarter. Long-term debt currently stands at $5.18 billion, versus more than $12.5 billion in January of 2015.
Dividend: GOLD’s annual divided is $.28 per share and translates to a yield of about 1% at the stock’s current price. A year ago, the dividend was $.16 per share, so the increase is a good sign that the company is focused not only on managing their business but also about finding constructive ways to return value to its shareholders.
Price/Book Ratio: there are a lot of ways to measure how much a stock should be worth; but I like to work with a combination of Price/Book and Price/Cash Flow analysis. Together, these measurements provide a long-term, fair value target around $12.80 per share. That means the stock is actually pretty heavily overvalued right now, with -24% downside from its current price.
Technical Profile
Here’s a look at the stock’s latest technical chart.
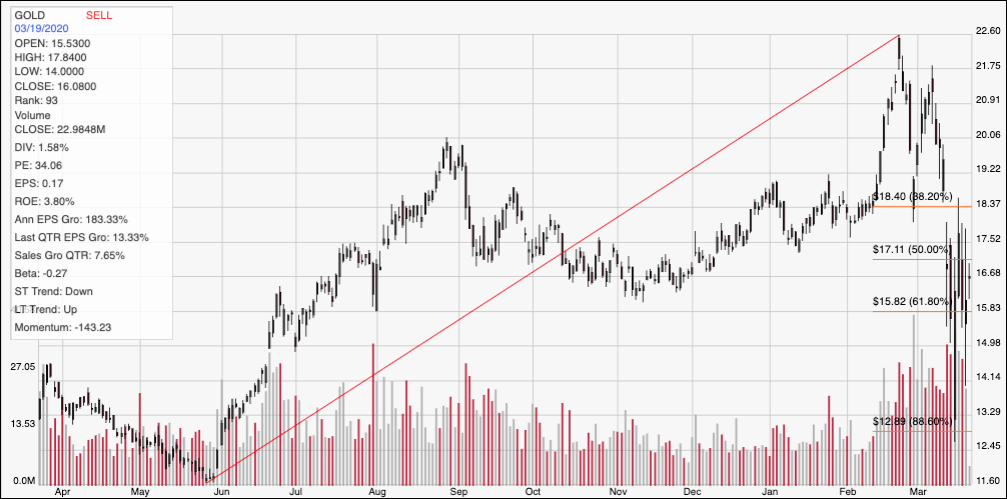
Current Price Action/Trends and Pivots: The chart above shows the last twelve months of price activity for GOLD. The stock’s current short-term upward trend is easy to see, with the red diagonal line tracing it from its low in May 2019 to its high in February of this year. That line also provides the baseline for the Fibonacci retracement lines on the right side of the chart. From the peak, the stock dropped back to the 61.8% retracement line and has shown quite a bit of volatility around that level, while managing to mostly hold that level around $16 per share. Immediate resistance is around the 38.2% Fibonacci retracement line, at about $18.50 per share, with support right at $16. If the stock drops below $16, it could easily drop back to the 88.6% retracement line before finding new support between $12 and $13 per share. A rally above $18.50 could give the stock bullish momentum to test previous highs between $21 and $22.50 per share.
Near-term Keys: Considering GOLD’s fundamental strength, it’s admittedly a bit surprising to see that the value proposition doesn’t quite line up with it. That means that if you want to consider this stock as a long-term play, don’t do it because you think it’s a bargain at it current price. This could be useful as a hedge against broader market risk, but keep in mind that the valuation metrics don’t project a lot of upside for the stock from its current price. If you prefer to work with short-term trades, a drop below $16 could offer an interesting opportunity to short the stock or to work with put options, while a push above $18.50 could be a very useful signal to think about buying the stock outright or to use call options to ride a short-term rally to the $21 to $22 range.