With the entire country on a lockdown that most experts aren’t expecting to end quickly – even as indications are that the infection curve is indeed starting to flatten in the U.S. and cities, states, and even the federal government starting to work on plans to get the economy restarted, and to determine when the time to do it is right – it might sound a little odd to start talking about winners in the stock market right now. Then again, given the way the market has rebounded over the last week, maybe it isn’t.
I’ve seen a lot of conversation among economists and talking heads over the last few weeks, not about if the market’s plunge into bear market territory would last, or whether the economic impact of the pandemic will be material, but rather how long the inevitable recovery will take. I agree with experts – economists and medical professionals in particular – who expect the actual recovery to be more gradual, which means the residual economic and social effects could last into the end of the year. From a visual perspective, that means that charting the drawdown and recovery over time should take a pretty clear U-shaped pattern.
The stock market clearly seems to want that to happen sooner, which isn’t all that surprising; the market has historically always priced expectations, fears and hopes for the health of the economy on an anticipatory basis. I think that might be the simplest and most straightforward to explain the immediate bounce off of lows that the broad indices, and many stocks throughout the market saw in the last week of March, with a rapid ascent off of those lows. Visually, that forms a clear, V-shaped pattern, which is a pronounced difference from the U-shaped pattern expect to see as the eventual, ultimate confirmation of economic recovery.
In most cases, I think the stocks that have followed that same pattern are at an elevated risk right now to drop back and to revisit some of that bear market territory. There are a few exceptions, though in sectors that have historically shown resilience during troubling economic periods. Healthcare stocks, including medical equipment manufacturers and pharmaceutical companies are an exception given the current health crisis that is going to take a year or more to fully put to rest throughout the world. Another one that doesn’t surprise me, but I think has surprised a lot of other analysts is the Food Products industry. As the reality of social distancing and shelter-in-place mandates set in, consumers flocked to grocery stores to stockpile basic goods. Joke all you want about toilet paper and bottled water shortages, but another area that has seen dramatically increased demand is Packaged Foods, including protein producers. That means that some of the stocks I’ve been paying the most attention to for more than a year, like Conagra Brands, Inc. (CAG) have been some of the biggest standouts over the last month or so.
CAG followed the rest of the market into bear market territory in March, dropping from a 52-week high around $35.50 to a low below $23 in March. Following a report around that bottom, however, that CAG’s shipment had increased over 50% versus the year before, the market pushed the stock aggressively higher; as of this writing, the stock is just a few dollars below that 52-week high. While the actual impact of that increase on earnings won’t be seen until the end of the current quarter (the actual report is due in June), the stock’s fundamental profile, which already showed signs of strengthening, should only get even better. The happy irony to see as a value-focused investor is that despite the stock’s increase of about 43% from its bottom in mid-March, the value proposition is still interesting. Don’t believe me? Let’s take a look.
Fundamental and Value Profile
Conagra Brands, Inc., formerly ConAgra Foods, Inc., operates as a packaged food company. The Company operates through two segments: Consumer Foods and Commercial Foods. The Company sells branded and customized food products, as well as commercially branded foods. It also supplies vegetable, spice and grain products to a range of restaurants, foodservice operators and commercial customers. Conagra Foodservice offers products to restaurants, retailers, commercial customers and other foodservice suppliers. The Company also operates in the countries outside the United States, such as Canada and Mexico. The Company’s brands include Marie Callender’s, Healthy Choice, Slim Jim, Hebrew National, Orville Redenbacher’s, Peter Pan, Reddi-wip, PAM, Snack Pack, Banquet, Chef Boyardee, Egg Beaters, Rosarita, Fleischmann’s and Hunt’s. The Company sells its products in grocery, convenience, mass merchandise and club stores. CAG’s current market cap is $16.1 billion.
Earnings and Sales Growth: Over the last twelve months, earnings decreased about -8%, while Revenues declined -5.6%. In the last quarter, earnings dropped by -25%, while Revenues were about -9.4% lower. While the earnings pattern doesn’t impress, the company’s margin profile over the last twelve months is improving, with Net Income at 7.37% of Revenues over the past twelve months, and strengthening in the last quarter to 8%.
Free Cash Flow: CAG’s free cash flow is modest, but strengthening at $905.9 million. That marked an increase from $575.6 million at the beginning of 2019, and translates to a Free Cash Flow Yield of about 5.82%.
Debt to Equity: CAG has a debt/equity ratio of 1.16. That number declined from 1.58 at the beginning of 2019, but the number remains high, a reflection of the reality that the company’s liquidity could be a problem. In the last quarter Cash and liquid assets were $99 million versus $9.09 billion in long-term debt. Most of that debt is attributable to CAG’s acquisition of Pinnacle Foods in the last quarter of 2018. The complexities associated with the transition of the two companies into one is part of the reason the stock struggled into the early part of 2019, but reports in the last two quarters indicate that the synergies the company has worked to achieve have been working. In the last year, long-term debt declined by about $2 billion, which is a positive.
Dividend: CAG pays an annual dividend of $.85 per share, which translates to an annual yield that of about 2.66% at the stock’s current price.
Price/Book Ratio: there are a lot of ways to measure how much a stock should be worth; but I like to work with a combination of Price/Book and Price/Cash Flow analysis. Together, these measurements provide a long-term, fair value target around $38.50 per share. That means the stock is undervalued, with about 17% upside from its current price. That isn’t quite as high as I prefer under ideal circumstances, but is still good enough to be interesting.
Technical Profile
Here’s a look at the stock’s latest technical chart.
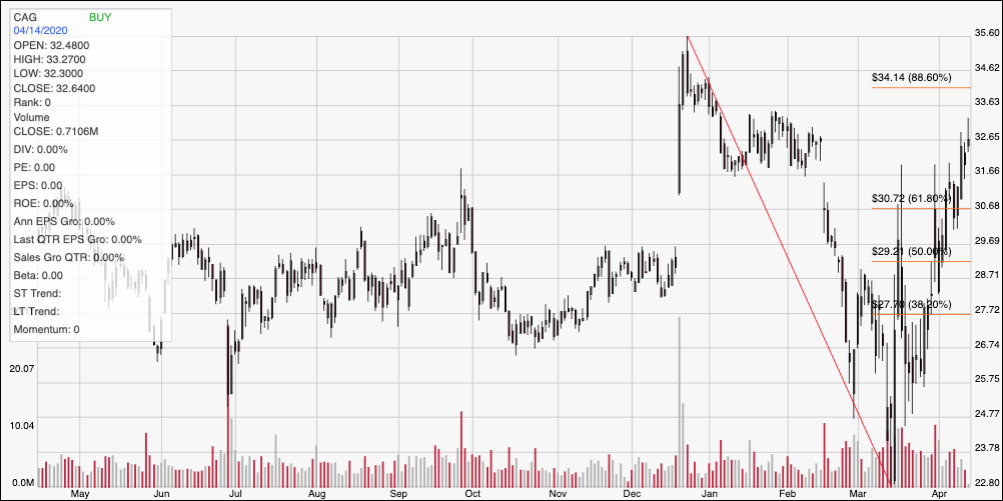
Current Price Action/Trends and Pivots: The chart above marks the stock’s price activity over the last year. The V-shaped pattern of the stock’s drop from the beginning of the year, followed by its rapid rise in the last month is obvious. Current resistance is around $33.50, based on pivot high activity seen in January and February around that level, with immediate support around $31.50 using pivot lows from that same timeframe. A break above $33.50 could give the stock room to test its 52-week high around $35.50, with additional upside in the $37 to $38 range based on highs seen in that price area in late 2018. A drop below $31.50 could see further downside to about $29, a little below the 38.2% Fibonacci retracement line shown on the chart but supported by pivot highs in that area in December 2019.
Near-term Keys: From a fundamental standpoint, CAG’s profile is very attractive, and its value proposition remains very interesting. Since social distancing and even stay-at-home measures aren’t going to go away quickly, I think that demand for packaged food products such as what CAG offers is going to remain consistent, and that I believe that means CAG will continue to stand out in the stock market through the year. If you prefer to work with short-term strategies, a break above resistance at $33.50 would be an interesting signal to consider buying the stock or buying a call option with an eye on $35.50 to $37 as an exit target. A drop below $31.50 could act as a signal to consider shorting the stock or working with put options, using $29 as a quick exit target level on a bearish trade.