Being a contrarian investor can mean a few different things. One is that contrarian investing is often correlated with value investing, and I think that makes sense in a lot of ways. That includes the reality that all price trends – up or down – are finite in length and duration. That means that eventually, upward trends reverse down, and downward trends inevitably reverse up. Technical traders like to identify stages where those reversals become more likely as ways to start looking for signals to reverse the direction of their trading. It is also one of the keys I like to use to supplement my value analysis, and to increase the probabilities the stocks I work with could be good bargains and useful opportunities to profit from a reversal to a new upward trend.
Another reason value analysis and the contrarian mindset often dovetail very nicely with each other is because while most investors shy away from stocks that are dropping, value investors and contrarians alike start to take them more seriously. It also tends to shade an investor’s perspective when a stock is going up; the longer an upward trend lasts, the more a contrarian begins to doubt the trend will be able to last. That is an attitude that often flies in the face of the herd mentality that often accompanies big upward moves in a stock’s price – especially if broader economic or societal conditions coincide with that rally.
The J.M. Smucker Company (SJM) is an interesting example of what I mean. If you’ve followed this space for very long, you’ve seen me write quite a bit about my opinion that stocks in the Consumer Staples sector, and Food Products even more specifically, are a good place to be putting your money. A few months ago, that was a strongly contrarian claim to make, because the sector and that industry were pretty strongly out of favor with the movement of the rest of the market. SJM’s price movement at that time mirrored the industry, dropping from a high at around $128.50 to a low at the beginning of the year at around $103 per share. As COVID-19 fears increased, and social distancing and stay-at-home measures were put in place across North America to try to limit the virus’ spread, Food Products stocks like SJM started to see a big jump in volatility as the swings in price became more and more dramatic. After hitting a new low in mid-March at around $95, SJM started a big, new rally, and as of this writing is around $118 per share. That makes my recommendations in late 2019 look pretty good, but it begs the question of whether the stock has moved enough to erase the value argument. Are the fundamentals strong enough to say the stock could still be a good bargain? Let’s find out.
Fundamental and Value Profile
The J. M. Smucker Company is a manufacturer and marketer of branded food and beverage products and pet food and pet snacks in North America. The Company’s segments include U.S. Retail Coffee, U.S. Retail Consumer Foods, U.S. Retail Pet Foods, and International and Foodservice. The Company’s U.S. retail market segments consist of the sale of branded food products to consumers through retail outlets in North America. In the U.S. retail market segments, the Company’s products are sold to food retailers, food wholesalers, drug stores, club stores, mass merchandisers, discount and dollar stores, military commissaries, natural foods stores and distributors, and pet specialty stores. In International and Foodservice, the Company’s products are distributed domestically and in foreign countries through retail channels and foodservice distributors and operators, such as restaurants, lodging, schools and universities, healthcare operators.SJM’s current market cap is $13.6 billion.
Earnings and Sales Growth: Over the last twelve months, earnings improved 3.98%, with sales growth declining -1.97%. In the last quarter, earnings again increased by 3.98%, while sales were flat, but positive at 0.74%. SJM’s margin profile is healthy, and getting stronger; over the last twelve months, Net Income was 8.2% of Revenues, and increased in the last quarter to about 9.5%. These are signs the company is operating more efficiently right now than it was just a few months ago.
Free Cash Flow: SJM’s free cash flow is adequate, at a little over $956.4 million for the trailing twelve month period; that translates to a Free Cash Flow yield of about 7.26%. SJM’s free cash flow has improved from late 2019, when the number was just about $723 million.
Debt to Equity: SJM has a debt/equity ratio of .58, a relatively low number that indicates the company operates with a conservative philosophy about leverage. This number has decreased over the last few quarters from .73 as the company suspended stock buybacks and dividend increases to concentrate on debt paydown. A big portion of their long-term debt, which was about $4.7 billion in the last quarter comes from the acquisition of pet food company Ainsworth in May of 2018 for $1.7 billion. Cash and liquid assets are severely limited, at only $74.4 million, but this is an improvement from the latter part of 2019 when cash was only around $48 million. While their balance sheet for now indicates their operating margin is more than adequate to service their debt, the fact is that liquidity is a concern and could be a challenge in quarters to come. The increase is a good sign, but cash needs to keep increasing, with long-term debt coming down, to mark a significant change in SJM’s balance sheet strength.
Dividend: SJM pays an annual dividend of $3.52 per share, which translates to a yield of 3.05% at the stock’s current price.
Price/Book Ratio: there are a lot of ways to measure how much a stock should be worth; but I like to work with a combination of Price/Book and Price/Cash Flow analysis. Together, these measurements provide a long-term, fair value target around $124 per share. That means the stock is only somewhat undervalued, with about 7% upside from its current price.
Technical Profile
Here’s a look at the stock’s latest technical chart.
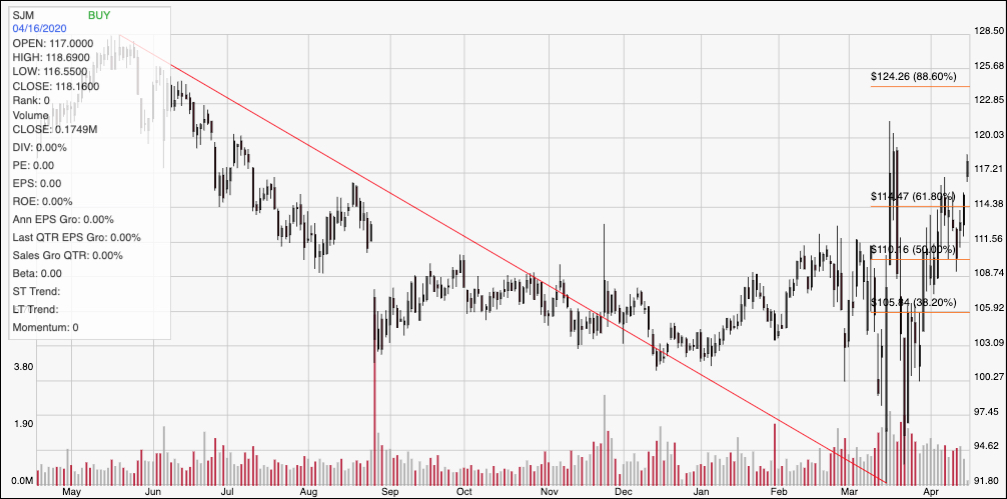
Current Price Action/Trends and Pivots: The chart above displays the stock’s price activity over the last year. The red diagonal line traces the stock’s downward trend from May of last year to its extreme low at around $92. The stock’s rally from that point is sizable and easy to see, with the stock breaking above the 61.8% retracement line in the last two days. Immediate resistance is around $120, with room from a break above that level to run to between $124 and $128.50. The move above the 61.8% retracement provides a good level for new support at around $114. If the stock reverses and drops below that level, it should find next support in the $110 range, or possibly $105 where the 38.2% retracement line rests if bearish momentum increases.
Near-term Keys: SJM’s fundamentals are generally solid, with the possible exception of the fact that liquidity remains a red flag. Even so, the value proposition at the stock’s current price just isn’t good enough to justify using SJM for any kind of long-term investment right now. If bullish momentum continues and pushes the stock above $120, you could use that as a signal to buy the stock or work with call options, using $124 as a good initial exit target. If momentum forces the stock to reverse, use a drop below $114 as a signal to consider shorting the stock or working with put options, with $110 acting as the exit target on a bearish trade.