The last couple of weeks have seen the market rallying strongly, driven primarily by plans announced by various state governments loosening restrictions on business operations and on public lands access. Some have already begun doing that, while others plan to begin on or around May 1. Others in some of the hardest-hit areas of the country are proceeding more cautiously. In the meantime, Congress approved another round of small business stimulus last week, and the Federal Reserve announced last night it would dive even deeper into the municipal bond market to keep liquidity strong – at state, county, and even local levels.
All of these measures seem to be giving investors hope that, while the threat of infection from COVID-19 remains, we might be able to find a balance between managing the health crisis and keeping the economy going. If that’s the case, then some of the areas that have seen the biggest drops in economic stability in the last month or so – unemployment and therefore consumer confidence, in particular – could start to see material improvements.
Even if that “best case” scenario plays out, I think that any real economic recovery is going to take some time to play out in practical terms. That’s why I think that some of the smartest areas of the economy to focus on are going to be the same segments I’ve been focusing pretty heavily on since late last year. That means sectors that have proven to remain stable, or even resistant to economic downturns. Consumer Staples have been one of the best places to put your money in the last couple of months, and I think that is going to continue to be the case.
Archer Daniels Midland (ADM) is one of the biggest food processing companies in the U.S. The stock has been struggling for most of the last two years; pressures include tariffs from the U.S. – China trade war that started in 2018 and lasted until late last year, along with competition in an already crowded market space that got even more so when Amazon bought Whole Foods. As a result, the stock fell from a peak in October 2018 around $52 to a low in late March at around $29 – a drop of not quite -50%. From that point, the stock has rebounded nicely, peaking just a little below $38 earlier this month. It is currently consolidating between that high and support at around $35 – which means that it could be setting up the kind of nice, bullish breakout pattern that often signals a long-term trend reversal. Do the stock’s fundamentals support that technical thesis, along with its value proposition? Let’s find out.
Fundamental and Value Profile
Archer-Daniels-Midland Company is a processor of oilseeds, corn, wheat, cocoa and other agricultural commodities. The Company manufactures protein meal, vegetable oil, corn sweeteners, flour, biodiesel, ethanol, and other food and feed ingredients. Its segments include Agricultural Services, which utilizes its United States grain elevator, global transportation network and port operations to buy, store, clean and transport agricultural commodities, such as oilseeds, wheat, milo, oats, rice and barley, and resells these commodities primarily as food and feed ingredients and as raw materials for the agricultural processing industry; Corn Processing, which is engaged in corn wet milling and dry milling activities; Oilseeds Processing, which includes global activities related to the origination, merchandising, crushing and further processing of oilseeds; Wild Flavors and Specialty Ingredients products, which include flavors, sweeteners and health ingredients; Other, and Corporate. ADM’s current market cap is about $20.3 billion.
Earnings and Sales Growth: Over the last twelve months, earnings increased more than 61%, while sales rose modestly, by 2.4%. In the last quarter, earnings rose more than 84% while sales declined -2.37%. The company operates with a very narrow margin profile, which isn’t that uncommon in its industry. Net Income versus Revenues over the past year is 2.13%, but improved somewhat in the last quarter to 3.09%.
Free Cash Flow: ADM’s free cash flow is negative, by about -$6.2 billion, and that is a big red flag; it is an indication that the company’s financial flexibility is becoming more restrictive. This is a number that, like Net Income, has been negative since the beginning of 2017, only briefly touching positive territory in the first quarter of 2018, but declining steadily from that point to the current quarter.
Debt to Equity: ADM has a debt/equity ratio of .40. This is a conservative number, but in this case doesn’t improve the fundamental profile. The company’s balance sheet indicates that operating profits are adequate to service their debt, with about $5.3 billion in cash and liquid assets versus more than $7.6 billion in long-term debt; however ADM’s negative Free Cash Flow suggests that the company is having to rely largely on cash to service its debt. The longer that condition persists, the more likely liquidity is to become a question mark. The interesting counterpoint to the negative picture I just painted is that cash and liquid assets have remained stable throughout most of the past six months, as has long-term debt, with no indication that the negative Free Cash Flow has bled through to the bottom line as of yet.
Dividend: ADM pays an annual dividend of $1.44 per share, which translates to an attractive yield of 3.94%.
Price/Book Ratio: there are a lot of ways to measure how much a stock should be worth; but I like to work with a combination of Price/Book and Price/Cash Flow analysis. Together, these measurements provide a long-term, fair value target around $47 per share. That means that ADM is attractively undervalued, with a little more than 29% upside from its current price.
Technical Profile
Here’s a look at the stock’s latest technical chart.
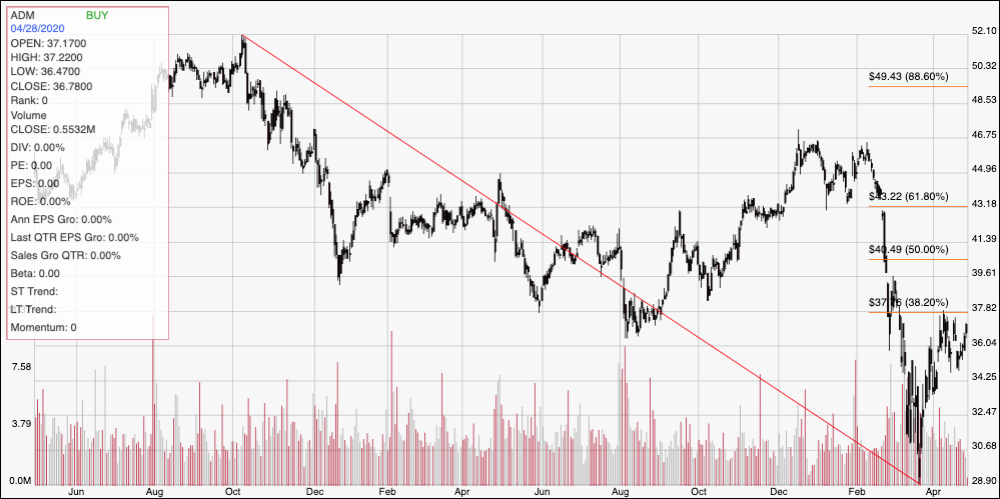
Current Price Action/Trends and Pivots: The chart above displays the stock’s price activity for the past two years. The diagonal red line traces the stock’s downward trend from October of 2018 to its most recent bottom in March, and provides the baseline for the Fibonacci retracement lines shown on the right side of the chart. From that recent low point, the stock rebounded to briefly touch the 38.2% retracement line at close to $38 earlier this month before dropping back. The stock is now hovering between that immediate resistance level and support at around $35. A push above $38 could give the stock solid bullish momentum to push to anywhere between $42 and $43, where the 61.8% retracement line sits right now. On the other hand, a drop below $35 could force the stock to revisit its March lows around $29 per share.
Near-term Keys: The stock’s current bullish rally looks like it could be building a useful upward trend; if the stock breaks above $38 and you prefer to work with short-term trading strategies, consider buying the stock or working with call options, using $42 to $43 as a useful profit target. A break below $35 would be a strong signal to consider shorting the stock or buying put options, with a profit target anywhere between $32 and $29 on a bearish trade. The stock’s value proposition looks very interesting; but I have to admit that the company’s extended pattern of negative Free Cash Flow is a big enough concern to blunt my interest; it would be important to see ADM’s current pattern of declining Free Cash Flow reverse and start to show signs of improvement before I would be willing to take the stock more seriously as a long-term investment opportunity, despite some intriguing macroeconomic reasons to think ADM’s prospects could be poised to improve. The smart approach for now as a value investor is to be patient and wait to see if the company can begin to show a material improvement in this area over the next quarter or two.