No matter what your investing philosophy is, or how you go about identifying stocks in which to consider putting your money to work, one of the most basic questions you have to ask yourself if whether the potential opportunity outweighs the opposite potential for loss. I like to call that portion of my system reward: risk analysis. How much reward is required for the risk you might need to accept in an investment depends largely on the investing style of method you’re using. For short-term trading strategies like swing or momentum trading methods, I like to use a minimum threshold of 2:1, meaning that the potential reward has to outweigh the risk by at least double.
Longer-term investing methods, like value investing, are a little harder to pin down in the same way. That’s because the basic premise behind value investing doesn’t really factor near-term risk into an investing decision’s question. If a stock is currently priced at a significant discount to what your analysis indicates the intrinsic value of the core business is, short-term risk is usually dismissed in favor of the long-term outlook. What that doesn’t eliminate, or even try to make easier, is the emotional weight of watching a stock drop significantly below the price you bought it at. A pure value investing model simply assumes that you’re in for the long haul and are willing to ride out any short-term dips or troughs in a stock’s price, no matter how dramatic or steep they may be.
One of the things I like about value investing is the way that it naturally gravitates to stocks that are generally already at or near historical low prices. Under normal circumstances, that usually means that the downside risk aspect is minimized simply because the market is usually more likely to push a stock higher out of those extreme lows once investors begin to recognize the value proposition is in place. That typically means my reward: risk analysis is easier to skew in my favor – especially if the underlying business is healthy.
The exception to the case comes under extraordinary market conditions, but it doesn’t always apply the same way to all stocks, in all sectors or industries. Within industry groups, there are even exceptions to the rule. Broad, global economic shutdowns from the COVID-19 pandemic certainly fit the “extraordinary” category, and so it isn’t all that surprising that just about every sector of the economy has been impacted in one way or another. In terms of basic bargain proposition, that also means that the number of stocks that are now trading at significant, if not massive discounts to their normal valuation levels is much higher than it was at the beginning of the year. As governments take steps to reopen economies while still dealing with the reality of the health crisis the pandemic represents, you might be tempted to latch on to some of those favorite, well-known stocks that are now trading at steep, steep discounts, on the expectation that a return to business – perhaps not exactly “as usual”, but at least on an accelerated basis – means higher revenues, higher profits, and therefore, higher prices.
The thing that I think is going to be important to keep in mind is that the last few months have forced businesses to rethink the way they do business in major ways. Initially, many of the measures they put in place to keep things going, including sending workers home and setting up, in some cases, 100% work-at-home arrangements were intended as temporary measures; but I believe that many businesses are going to determine that some of those changes, while forced on them, ultimately proved beneficial to their business in unexpected, but possibly permanent ways. Work-at-home and telecommuting solutions, for example, a few months ago were considered useful, but limited-use options for most businesses, but I think that many businesses will choose to keep those arrangements in place for the foreseeable future, both for health and safety as well as operational efficiency purposes.
One of the companies that I think could be challenged by a long-term, potentially permanent reduction of in-office staffing is Xerox Holdings Corporation (XRX). This is a company whose business is built around digital printing technology and workplace solutions. Their last earnings report, released last week indicated big impacts on their business; those setbacks have been strong enough to derail the company’s expectations for revenue and profitability growth into next year and beyond. The stock has been holding for most of the last few months in a narrow trading range below $20, and even with the recent unfavorable report is trading at a massive discount; but is the risk to the company’s core business so great right now that it doesn’t justify making a long-term bet on the stock? Let’s find out.
Fundamental and Value Profile
Xerox Corporation is a provider of digital print technology and related solutions. The Company has capabilities in imaging and printing, data analytics, and the development of secure and automated solutions to help customers improve productivity. The Company’s primary offerings span three main areas: Managed Document Services, Workplace Solutions and Graphic Communications. Its Managed Document Services offerings help customers, ranging from small businesses to global enterprises, optimize their printing and related document workflow and business processes. Managed Document Services includes the document outsourcing business, as well as a set of communication and marketing solutions. The Company’s Workplace Solutions and Graphic Communications products and solutions support the work processes of its customers by providing them with printing and communications infrastructure. XRX’s current market cap is about $3.5 billion.
Earnings and Sales Growth: Over the last twelve months, earnings declined nearly -77%, while sales decreased by about -15.7%. In the last quarter, the decline in earnings accelerated to -84.2% while revenues were nearly -24% lower. XRX’s operating profile before the pandemic set in was very healthy; over the last twelve months, Net Income was almost 14% of Revenues; however in the last quarter, this metric plunged into negative territory at -0.11%. It is possible that proves to be a temporary element of an otherwise healthy operating model; but the size of the decline is alarming and should be taken as a major red flag until and unless improvement is seen in the quarters ahead.
Free Cash Flow: XRX’s free cash flow is healthy, at a little more than $1.2 billion. That translates to an attractive Free Cash Flow Yield of more than 33%. It is also worth noting that XRX’s Free Cash Flow was $0 in June of 2018, with the company showing consistent improvement in this critical metric from that point. While that acts as an interesting counterpoint to the company Net Income story, it bears watching in quarters ahead to determine if Free Cash Flow also begins to deteriorate.
Debt to Equity: XRX has a debt/equity ratio of .58. That’s generally a conservative number that reflects management’s approach to debt management. Since the beginning of 2018, the company’s long-term debt has decreased from a little more than $5.2 billion to its current level of $3.2 billion. Their balance sheet also shows more than $2.6 billion in cash and liquid assets, which means that servicing their debt isn’t a problem, and provides an important buffer, even if Net Income remains challenged.
Dividend: XRX pays a dividend of $1.00 per share, which translates to an annual yield of 5.87% at the stock’s current price. The dividend could provide signals of fundamental weakness or strength, depending on whether management chooses to leave it as is, or as some companies have already started doing, decides to reduce or even eliminate it to save cash. For now, there are no signs the dividend is in danger.
Price/Book Ratio: there are a lot of ways to measure how much a stock should be worth; but I like to worth with a combination of Price/Book and Price/Cash Flow analysis. Together, these measurements provide a long-term target at about $28.50 per share. That’s suggests the stock is significantly undervalued, by more than 33% right now.
Technical Profile
Here’s a look at the stock’s latest technical chart.
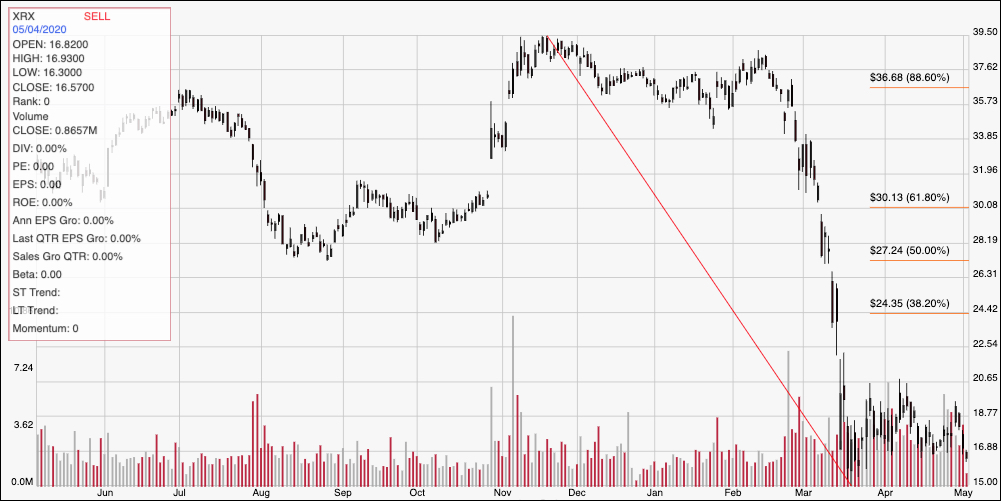
Current Price Action/Trends and Pivots: The diagonal red line traces the stock’s downward plunge from its high at around $39.50 in November to the stock’s low point, reached in mid-March at around $15. The lion’s portion of that drop came in one month, from February to March, with the broad market’s nosedive into bear market territory. While the broad market indices have rebounded since then, the stock has languished, hovering in a narrowing range between support at $15 and resistance at around $19. The stock is current showing bearish momentum, and is nearing support. A drop below $15 would put the stock into territory it hasn’t seen since the last bear market in 2009, with next possible support between $10 and $12 per share. The current sideways trend does mark a consolidation range that could be useful as a springboard to higher prices, provided the stock can break above $19 per share; in that case, the stock should see little in the way of resistance until the stock reaches the 382.% Fibonacci retracement line, which is currently a little above $24 per share.
Near-term Keys: XRX has a very attractive value proposition, and some intriguing fundamental strengths as reflected by its current balance sheet that could make it a tempting stock for value investors. I think current market and economic risks, however make this a stock to hold off of buying, but to watch closely in quarters ahead. An improvement in Net Income on quarterly basis, with continued stability in Free Cash Flow, cash, and long-term debt levels could be a good sign that the last quarter was just a one-time anomaly for a company with an overall solid fundamental profile. If you prefer to work with short-term trading strategies, the current sideways trend doesn’t offer much in the way of immediate trading catalysts; however a drop below $15 could be taken as a signal to consider shorting the stock or buying put options, using a level between $12 and $10 as a profit target on a bearish trade. If the stock can pick up some bullish momentum and break above $19, it would offer a strong signal to buy the stock or work with call options, using $24 as the exit point on a bullish short-term trade.