Even before COVID-19 put a stranglehold on business activity, travel, and consumer demand in just about every respect (except healthcare, basic supplies and food storage), global auto sales were under pressure. The industry was hampered through most of the past two years by trade tensions between the U.S. and its largest trading partners, which included tariffs on autos, steel, and aluminum. In addition, an increasing consumer push to electrical vehicles is having an impact on America’s Big Three automakers – General Motors, Ford, and Fiat Chrysler.
Earnings reports this quarter are showing a clear impact coming from coronavirus on business operations across multiple fronts, which means that companies that were already operating with healthy balance sheets – good liquidity, healthy cash flow, and conservative, manageable use of debt – are clearly starting to separate themselves from the crowd. I think that distinction is going to become even more important in the quarters to come, as economies gradually move to get things restarted and communities, states and national governments learn to cope with and manage COVID-19 as part of a “new normal.” I would be surprised if that goes smoothly – in fact, I think that in the near-term, we’re likely to see things start and stop off and on in different parts of the U.S. as new breakouts occur, or possibly more dangerous, secondary waves are seen. As long as society has to deal with the pandemic without practical anti-viral treatments, much less actual, useful vaccines, I don’t think it will be surprising to see restrictions lifted, then re-imposed to some degree or in some fashion.
That risk, I think is part of the reason that, even as automakers are advertising as loudly as possible now about the incredible deals they can offer on new vehicle purchases, the forecasts from most experts for the auto industry have sales declining as much as -17% through 2020, with modest improvement possible in 2021 but not really expected to be seen in a significant way until 2022. That’s a big reason why stocks like Magna International Inc. (MGA) remain more than -35% below their 52-week highs right now. It’s also why I don’t see a lot of analysts offering a lot of Buy recommendations on stocks in the industry right now. As an investor with a contrarian bent, that is actually intriguing to me, and a big part of the reason that I’ve started looking at some of the companies on the supply side of the industry – meaning, those that provide parts, materials, or services to automakers, including replacement parts for consumers – more closely.
MGA is a Canadian company whose biggest customers are the Detroit Big Three automakers. And while they’ve taken their lumps with the rest of the industry and the market, their balance sheet has been impressively resilient. And while they have suspended previously implemented share repurchase programs, the company has not altered or cut its dividend – nor are they any indications they need to. Their overall fundamental strength, with that attractive dividend, burnishes an already compelling value proposition even more, even if broad market conditions may keep the stock price under pressure for the foreseeable future. Does that mean you should buy the stock right now? That’s for you to decide. Here are the numbers.
Fundamental and Value Profile
Magna International Inc. (Magna) is a global automotive supplier. The Company’s segments are North America, Europe, Asia, Rest of World, and Corporate and Other. The Company’s product capabilities include producing body, chassis, exterior, seating, powertrain, electronic, active driver assistance, vision, closure, and roof systems and modules, as well as vehicle engineering and contract manufacturing. The Company has over 320 manufacturing operations and approximately 100 product development, engineering and sales centers in over 30 countries. It provides a range of body, chassis and engineering solutions to its original equipment manufacturer (OEM) customers. It has capabilities in powertrain design, development, testing and manufacturing. It offers bumper fascia systems, exterior trim and modular systems. It offers exterior and interior mirror systems. It offers sealing, trim, engineered glass and module systems. It offers softtops, retractable hardtops, modular tops and hardtops. MGA has a current market cap of about $11 billion.
Earnings and Sales Growth: Over the last twelve months, earnings declined more than -47%; Revenues also dropped -18.26%. In the last quarter, earnings dropped by -39%, while sales were -7.86% lower. MGA’s operating profile is narrow, but surprisingly is showing signs of strengthening; Net Income versus Revenues was 3.01% in the last quarter, versus 2.45% over the last twelve months.
Free Cash Flow: MGA’s free cash flow is healthy, at a little more than $2.7 billion. This number has been somewhat cyclic from one quarter to the next, but has shown a general, upward stair-step pattern of growth going back to the last quarter of 2016. It also translates to a very attractive Free Cash Flow Yield of 24.53%.
Dividend: MGA pays an annual dividend of $1.60 per share, which translates to an annual yield of 4.35% at the stock’s current price. The company has also increased the dividend from $1.32 per share, per year since late 2018, which is a strong indication of management’s confidence in their business.
Price/Book Ratio: there are a lot of ways to measure how much a stock should be worth; but I like to work with a combination of Price/Book and Price/Cash Flow analysis. Together, these measurements provide a long-term, fair value target around $58 per share. That means that MGA is undervalued by 58% from its current price around $37.
Technical Profile
Here’s a look at the stock’s latest technical chart.
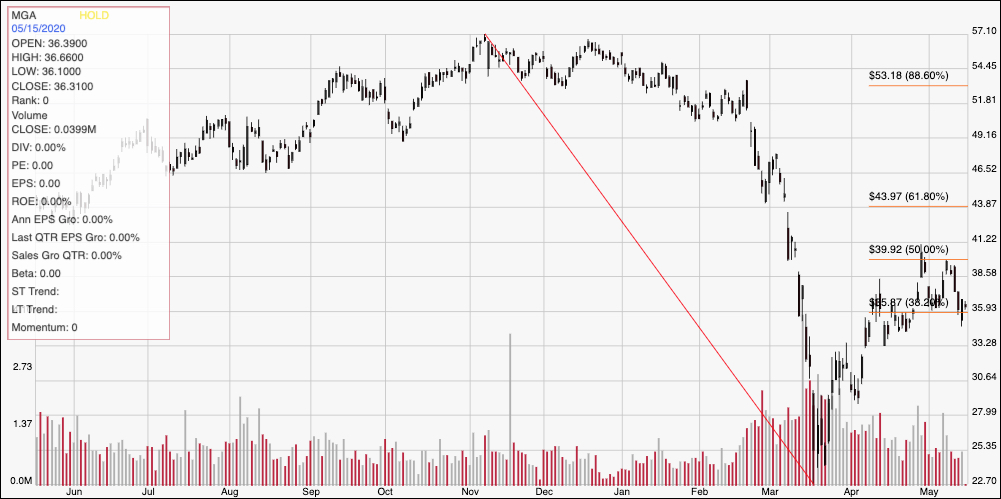
Current Price Action/Trends and Pivots: The chart above displays the stock’s price activity over the past year. The red diagonal line traces the stock’s downward trend beginning in November 2019 to its low point in March at around $23. It also provides the basis for the Fibonacci retracement lines on the right side of the chart. After breaking above the 38.2% retracement line in late April, the stock peaked at about $40 before dropping back to use $36 as a support point at the beginning of this month. Those two levels have begun to define a pretty specific trading range for the stock. A break above $40 should see additional upside to about $44, where the 61.8% retracement line sits, while a drop below $36 could give the stock momentum to fall as low between $32 and $30 based on pivot level at the end of March and beginning of April.
Near-term Keys: If you’re looking for a short-term bullish trading setup, you can take a break above $40 as a signal to buy the stock or work with call options, with an eye on the 61.8% line, which I expect to act as resistance around $44 per share. A push below $36 would act as a signal to short the stock or consider buying put options with a bearish profit target between $30 and $32. I expect near-term conditions for the stock to remain volatile, which means that even though the stock’s fundamentals are solid, and the value proposition is compelling, this is a stock you would have to be willing to take a long-term perspective with.