Since state governments began loosening COVID-19 mandated restrictions about six weeks ago, local economies have been getting restarted on a gradual basis. Today before the market opened, a new report on consumer spending seemed to show the kind of pent-up eagerness consumers have had to get back to some semblance of “normal”, as retail sales came in much higher in May than expected. That, along with news about progress on the treatment front, is giving investors some reasons to be bullish today, as the major indices are all up about 3% so far as of this writing.
Will today’s enthusiasm provide a springboard for the rest of the week, and allow the markets to resume the decisively bullish rally they’ve been staging since hitting a bear market low in March? Maybe – maybe not. For now, I’m taking today’s news as just another indication of the volatile, bipolar nature the market seems to have taken over the last few weeks. When things are good, they’re really good; but when they’re bad, they are really, really bad (last week’s big drop as a case in point).
A heightened state of market volatility can drive you nuts if you’re trying to make rational, objective decisions about how to put your money to work for you. That’s because the signals and triggers you’ve learned to use to identify signs of breakouts, continuations, and reversals start to break down; a “breakout” signal may end up really being a “fake out” signal, putting you exactly where you don’t want to be at exactly the wrong time. That creates second-guessing and doubt, which increases stress and emotional decision making. It really makes things more difficult than they need to be!
Conditions like we are experiencing now, and that make short-term trading strategies generally harder, are one of the reasons that I’ve come to use those technical indications of trends and short-term swings back and forth as just one piece of a broader puzzle to help me identify stocks that offer useful value. It isn’t that the volatility goes away; but when I can leaven the emotion that a stock’s current price action might encourage with a solid dose of reality about a company’s business based on current fundamental data along with whether the stock should still be worth more than its current trading price, it helps to make the process a less emotional and more manageable.
As the economy has reopened and earnings reports from the latest, pandemic-influenced quarter are starting to come in, it’s been interesting to see what kinds of stocks have been able to weather the storm. One of the surprisingly favorable industries, at least at first blush, is the Chemical industry, where I’ve begun finding indications companies were better positioned to deal with economic uncertainty than anticipated, and where balance sheets in a few cases have actually shown surprising improvement that underscore an interesting value story.
Huntsman Corp (HUN) is a good example. The stock’s price has rebounded strongly from its bear market low in March at around $12, and since mid-May has managed to stage an interesting short-term upward trend. More useful, however, is the fact that the company has managed to improve their operating profile since the beginning of the year, which has helped them increase their financial liquidity and boost the stock’s intrinsic value. All told, even with the stock’s recent bullish strength, there is still a useful, value-based opportunity to be had.
Fundamental and Value Profile
Huntsman Corporation is a manufacturer of differentiated organic chemical products and of inorganic chemical products. The Company operates all of its businesses through its subsidiary, Huntsman International LLC (Huntsman International). The Company operates through five segments: Polyurethanes, Performance Products, Advanced Materials, Textile Effects, and Pigments and Additives. Its Polyurethanes, Performance Products, Advanced Materials and Textile Effects segments produce differentiated organic chemical products and its Pigments and Additives segment produces inorganic chemical products. The Company’s products are used in a range of applications, including those in the adhesives, aerospace, automotive, construction products, personal care and hygiene, durable and non-durable consumer products, digital inks, electronics, medical, packaging, paints and coatings, power generation, refining, synthetic fiber, textile chemicals and dye industries. HUN’s current market cap is $4.3 billion.
Earnings and Sales Growth: Over the last twelve months, earnings declined almost -37%, while revenues dropped about -21.5%. In the last quarter, earnings were flat while revenues shrunk by -3.86%. The earnings pattern doesn’t look great, which isn’t too surprising given the recessive economic conditions that have existed since the beginning of the pandemic. The real story, however comes in the company’s margin profile, which had begun to solidify and improve in the first quarter of the year, and which has only strengthened since then. In the last year, Net Income was 16.1% of Revenues (an increase from 8.06% for the trailing twelve month period ended in the quarter prior), and increased to 44.26% in the last quarter (up from 34.3% in the quarter prior). The improvement is unexpected, but a good sign that the company has a firm hand on cost controls and it paying close attention to its balance sheet.
Free Cash Flow: HUN’s free cash flow is healthy at $588 million. This is a bit of a decline from the quarter prior, when Free Cash Flow was $623 million. That translates to a Free Cash Flow Yield of 14.8%. It is noteworthy that Free Cash Flow is still below its peak at $1.2 billion in June 2018, so there is still clearly work to still to be done to keep the company’s prospects bright in the quarters ahead.
Debt to Equity: HUN has a debt/equity ratio of .71. This is a conservative number that has also decreased in the last two quarters from .97. The improvement in the company’s Net Income is also reflected by an increase in liquidity, which is a positive development. Total cash in the last quarter was almost $1.6 billion (a significant increase from $525 million in the quarter prior), while long-term debt is $2.4 billion.
Dividend: HUN pays an annual dividend of $.65 per share, which translates to an annual yield that of about 3.5% at the stock’s current price.
Price/Book Ratio: there are a lot of ways to measure how much a stock should be worth; but I like to work with a combination of Price/Book and Price/Cash Flow analysis. Together, these measurements provide a long-term, fair value target around $23.50 per share. That means the stock is nicely undervalued, with about 20% upside from its current price. I think it also useful to note that HUN’s Book Value increased in the last quarter, from $12.31 to $15.34 per share.
Technical Profile
Here’s a look at the stock’s latest technical chart.
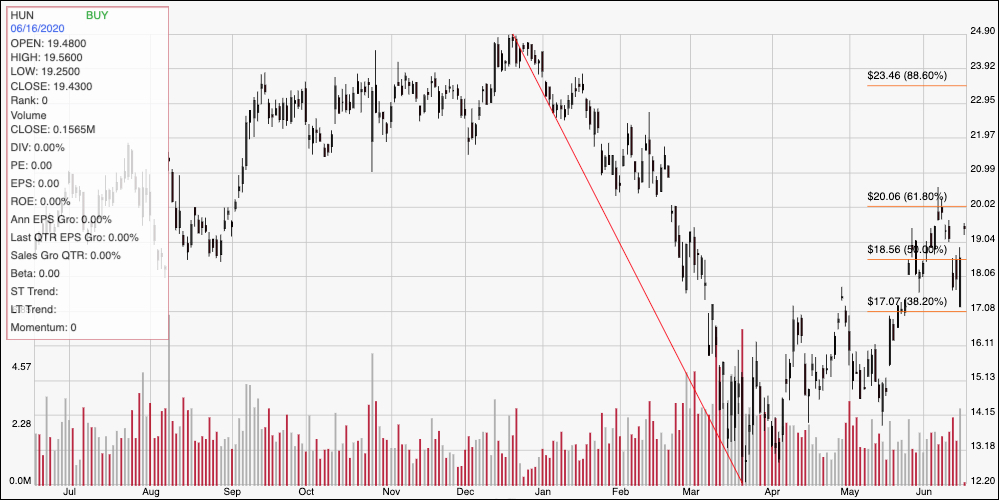
Current Price Action/Trends and Pivots: The diagonal red line on the chart above traces the stock’s downward trend from February of 2018 to its low point around $12 in March. It also provides the baseline for the Fibonacci retracement lines shown on the right side of the chart. After rallying to about $17 in mid April, the stock began to hover between $15 and $17 for most of the next month, but finally managed to break above $17 in mid-May. It hit its latest high point a little over a week ago a little above $20 before falling back last week to test $17 as support. Today, the stock pushed above resistance at $18.50 from the 50% retracement line and is approaching next resistance at its last peak, which also coincides with the 61.8% retracement line. A break above $20 could give the stock to keep surging and test its next resistance between $23 and $23.50 where the 88.6% retracement rests. Support should show be around $18.56; a drop below that point should find next support at $17, with $15 a tertiary support level beyond that point.
Near-term Keys: HUN’s current upward trend is intriguing, and offers tempting fodder for a short-term trader right now. If you’re willing to be aggressive, you could use today’s breakout as a signal to buy the stock or to work with call options, with an eye on pivot lows seen in the fourth quarter of 2019 around $22 acting as a useful first profit target, and $23.50 possible if bullish momentum remains strong. A more reliable signal would come from a break above $20 before placing a bullish trade. A drop below $18.50 might offer an interesting signal to short the stock or consider buying put options; but $17 should provide strong support in that case, so don’t plan to hold a bearish trade past that point. I think HUN’s value proposition, and its fundamental strength are compelling reasons to consider using this stock as a value-based buying opportunity, with attractive upside, a useful dividend, and a solid balance sheet providing a good basis for the stock’s long-term prospects.