The Materials sector is one of the more interesting sectors of the market, because it encompasses a pretty wide range of business types. It’s also an industry that the average consumer probably doesn’t think much about, I think primarily because as consumers we tend to be aware of just the finished goods and products that we use at any given time. Stocks in the Materials sector, however, are usually the companies that provide the components that manufacturers use to create the products and goods we consume. That’s where the diversity of business types comes into play: the sector includes paper manufacturers and wood processors to chemical companies producing everything from plastics to fertilizers and more.
The COVID-19 pandemic prompted a global economic shutdown that affected every sector of the global economy. Moving into roughly the second full month of reopening efforts around the country, there is plenty of uncertainty ahead – some parts of the U.S. have rolled back reopening plans and reintroduced some restrictions, while others continue to push ahead while looking for practical ways to manage the pandemic without closing economic activity all over again. One of the interesting places to analyze the pandemic’s impact is on the demand for agricultural products like corn. Corn is a crop that is used for everything from the dinner on your plate to the production of ethanol, a fuel additive designed to make fuel consumption cleaner and more environmentally friendly. High corn demand translates to high demand for nitrogen fertilizers.
Even as the global economy restarts, however, there are concerns that ethanol production, which naturally slowed while shelter-in-place orders were in effect around the world, will be slow to recover. Favorable weather in the U.S. during the first quarter gave farmers an opportunity to start planting early, which could also contribute to expected oversupply issues on this commodity. That could act as a drag on companies in the Materials sector like CF Industries Holdings Inc (CF). This is a mid-cap producer of nitrogen and phosphate fertilizer. That makes them highly dependent on natural gas and ethanol, and subject to the variances in prices of those commodities. Since hitting a post-pandemic high around $34 in June, the stock has tapered back to a current price a little above $29, which is probably driven by concerns about demand for its products. Even while dealing with cost concerns and the broad-based uncertainty that every business has in the last few months, however, CF has managed to maintain a solid fundamental profile. Along with the stock’s fundamental strength is an excellent value proposition that just might be too good to pass up right now.
Fundamental and Value Profile
CF Industries Holdings, Inc. manufactures and distributes nitrogen fertilizer, and other nitrogen products. The Company’s nitrogen fertilizer products are ammonia, granular urea, urea ammonium nitrate solution (UAN) and ammonium nitrate (AN). Its other nitrogen products include diesel exhaust fluid (DEF), urea liquor, nitric acid and aqua ammonia, which are sold primarily to the Company’s industrial customers, and compound fertilizer products (nitrogen, phosphorus and potassium or NPKs). The Company’s segments include ammonia, granular urea, UAN, AN and other. The Company’s ammonia segment produces anhydrous ammonia (ammonia), which is concentrated nitrogen fertilizer as it contains 82% nitrogen. The granular urea segment produces granular urea, which contains 46% nitrogen. The UAN segment produces urea ammonium nitrate solution. The Other segment includes DEF, urea liquor, nitric acid and NPKs. The Company’s primary nitrogen fertilizer products are ammonia, granular urea, UAN and AN.CF has a current market cap of about $6.2 billion.
Earnings and Sales Growth: Over the last twelve months, earnings increased by 14.8%, while revenues slipped by -3%. In the last quarter, earnings increased by 24% while sales declined -7.44%. The company’s margin profile is healthy, but has narrowed in the last quarter; Net Income as a percentage of Revenues in the last quarter is 7% versus 10.33% over the last twelve months.
Free Cash Flow: CF’s free cash flow is $1.16 billion. That translates to a very attractive Free Cash Flow of a little more than 17.95%.
Debt to Equity: CF’s debt to equity is .73, a conservative number that signals the company’s conservative approach to leverage. Their balance sheet shows cash and liquid assets were $753 million in the last quarter versus $3.95 billion in long-term debt. Their operating profile indicates that they have sufficient operating income to service their debt, with adequate liquidity to add to the mix. It should be noted that at the beginning of 2020, cash was notably higher, at around $1 billion. That is likely a reflection of the challenges faced by all of corporate in the wake of the early stages of the pandemic, and it is a concern; the question moving forward is whether the company’s liquidity will continue to deteriorate, stabilize, or start to increase again.
Dividend: CF’s annual divided is $1.20 per share, which translates to a yield of about 4.12% at the stock’s current price.
Price/Book Ratio: there are a lot of ways to measure how much a stock should be worth; but I like to work with a combination of Price/Book and Price/Cash Flow analysis. Together, these measurements provide a long-term, fair value target around $40 per share. That means that at the stock’s current price, it is significantly undervalued, with about 37% upside from its current price.
Technical Profile
Here’s a look at the stock’s latest technical chart.
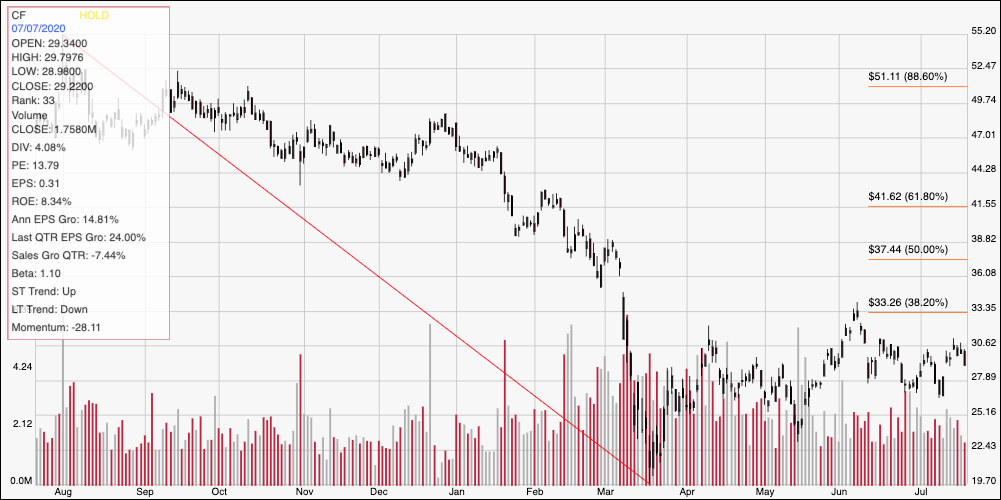
Current Price Action/Trends and Pivots: The diagonal red line traces the stock’s downward trend from July of last year to to its low point in March at around $20 per share. It also provides the baseline for the Fibonacci retracement levels shown on the right side of the chart. The stock rallied to a high around $34 in June before falling back to support around $28 at the end of the month. The stock rallied in the first part of July to a new high near $31 but has retraced again in the last couple of days, and appears to be approaching support at $28 now. Immediate resistance is around $31; a break above that level should give the stock room to run to near its June peak and in line with the 38.2% retracement line, which is a little above $33. A drop below $28 could see the stock fall to next support at around $24 based on a pivot low point in May.
Near-term Keys: CF’s fundamentals are strong and have held up relatively well even with COVID-19 acting as a significant headwind. It also carries a value proposition that has only gotten more attractive with the stock’s drop over the last month. If you prefer to work with short-term trading strategies, you could use a push above $31 as a signal to buy the stock or to work with call options, with a near-term price target at around $33. If the stock’s current momentum remains bearish, you could also use a drop below $28 to consider shorting the stock or working with put options, using $24 as an initial, quick-hit profit target on a bearish trade, with additional downside at around $20 where the stock saw its multiyear low in March.