Over the last week, the market has been set on pushing to new higher highs, with the Nasdaq setting a new all-time high at the beginning of this week and the S&P 500 breaking above its last pivot high in May. The start of a new earnings season seems to have lifted investor sentiment, as a number of companies have reported improving revenues and earnings from the last quarter.
I think it’s important to consider that while the market seems to be taking the early part of earnings season as a good sign that the economy can sustain a V-shaped recovery, any improvements that are being seen are in contrast to steep declines in many of those stocks in the quarter prior. If you throw the current numbers against the larger backdrop of time, even the most optimistic CEO’s and analysts are forced to admit that business still has a long way to go to reach the levels it was at before the pandemic hit. What also remains to be seen is what the impact renewed forced closures and reimposed restrictions in some states, who have been forced to pause or reverse reopening efforts in the face of massive spikes of new infections will be. The federal government is considering a new round of financial stimulus, including the extension of some benefits that have helped to blunt some of the worst effects on consumers, including the PPP program for small business owners, but Democrats and Republicans still seem far apart on an agreement on that score. Altogether, there is a strong case to be made that market and economic risk remains elevated.
Utility stocks are generally accepted as some of the most conservative stocks to work with when economic uncertainty, and the fear of a downturn or recession starts to increase. That means that stocks like Southern Co. (SO) start to look a lot more attractive the more likely a major reversal appears to be. This is a stock that plunged from a February high around $71 to a pandemic-induced low around $42. It found a new, near-term high in early June around $60 before slipping back again to around $50 by the end of that month. Through July, it appears to be building bullish momentum. Does that mean you should use the stock to keep your money working for you? Let’s run the numbers so you can decide for yourself.
Fundamental and Value Profile
The Southern Company (Southern Company) is a holding company. The Company owns all of the stock of the traditional electric operating companies and the parent entities of Southern Power Company (Southern Power) and Southern Company Gas, and owns other direct and indirect subsidiaries. The Company’s segments include Gas distribution operations, Gas marketing services, Wholesale gas services, Gas midstream operations and All other. The Gas distribution operations segment includes natural gas local distribution utilities that construct, manage, and maintain intrastate natural gas pipelines and gas distribution facilities in seven states. The Gas marketing services segment provides natural gas commodity and related services to customers markets that provide for customer choice. The Wholesale gas services segment engages in natural gas storage and gas pipeline arbitrage. The Gas midstream operations consist primarily of gas pipeline investments, with storage and fuels. SO’s current market cap is about $58.6 billion.
Earnings and Sales Growth: Over the last twelve months, earnings increased by about 11.4%, while sales decreased by -7.28%. In the last quarter, earnings improved by 188.9% while revenues improved by 2.12%. SO operates with a strong, stable operating profile; over the last twelve months Net Income was 16.68% of Revenues and 17.38% in the last quarter.
Free Cash Flow: SO’s free cash flow is a big concern at only $171 million over the last twelve months. That is a decline from about $3.34 billion at the end of 2019 and $6 billion a year ago.
Debt to Equity: SO has a debt/equity ratio of 1.44. That’s a high number that is a good indication of SO’s high leverage, which is pretty normal in the Utilities industry, which relies on stable operating cash flow (not the same as free cash flow) to service debt. Their balance sheet in the last quarter shows $2.1 billion in cash and liquid assets versus $45.8 billion in long-term debt.
Dividend: SO pays a dividend of $2.56 per share, which translates to an annual yield of about 4.67% at the stock’s current price.
Price/Book Ratio: there are a lot of ways to measure how much a stock should be worth; but I like to work with a combination of Price/Book and Price/Cash Flow analysis. Together, these measurements provide a long-term, fair value target for CF at around $65.50 per share. That means that at the stock’s current price, it is undervalued, with about 20% upside from its current price.
Technical Profile
Here’s a look at the stock’s latest technical chart.
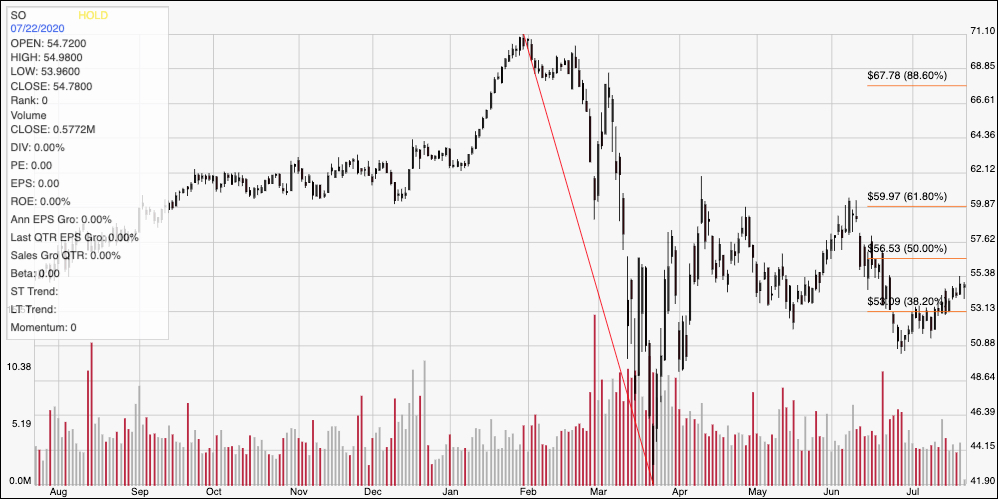
Current Price Action/Trends and Pivots: The diagonal red line traces the stock’s plunge from February to March. It also provide the baseline for the Fibonacci retracement lines shown on the right side of the chart. At the end of June, the stock hit a support point at around $51 and started to build bullish momentum that has helped the stock rally to its current price around $55 per share. Support is at the 38.2% retracement line, which sits and around $53, with immediate resistance at the 50% retracement line around $56.50. A break above that level should give the stock room to test its pandemic high around $60, while a drop below support at $53 should see it test next support at around the June low at $51.
Near-term Keys: SO is a stock with a mostly solid fundamental profile, but the company’s severely declining Free Cash Flow is a concern. An improvement in this number in the stock’s next earnings report would be a good validation of the strength of their other metrics, and a sign that the company’s liquidity, which is also a red flag, is improving. Otherwise, I’m more inclined to treat the stock’s value proposition as a trap than an opportunity. That means that the best opportunities to profit with this stock will likely come from short-term trading opportunities. Treat a break above $56.60 as an opportunity to buy the stock or work with call options, using $60 as an effective, quick-hit profit target. A drop below $53 could act as a signal to consider shorting the stock or buying put options, using $51 as a quick, first profit-target with lots of room down to $42 if bearish momentum accelerates.