The market is focusing most of its attention on an expanded list of companies reporting earnings this week, with investors eager to see if earnings provide indications that corporate America is weathering the pandemic storm successfully and to measure the odds that the economy will continue to recover. News over the weekend that lawmakers in Washington may be able to complete a second round of stimulus, including individual payments, extensions of expanded unemployment benefits (albeit somewhat modified), and more has added to the hope that the U.S. can keep its head above water while the Pharmaceutical industry races to complete make a practical vaccine available as quickly as possible.
The market seems to want to take all of that information as positive news and reasons to keep pushing stock prices and the major indices higher; but I think a smart investor treats it all with a grain of salt. If the optimistic forecasts and expectations prove to be unrealistic – and especially where the pace and timing of a practical vaccine is concerned, I think that is very much the case – then the bearish sentiment that pushed the market past bear-market in March of this year could come back with a vengeance. As investors seem to be more and more inclined to pile back into the market – applying what some analysts call a “risk on” mindset – I think the reward: risk profile of the broad market is starting to invert, where the amount of risk you take for every dollar of opportunity you might achieve is becoming unpractical. To me that means that it’s useful to keep paying attention to stocks in “boring” sectors and industries, like Food Products, Utilities, and so on.
Tyson Foods Inc. (TSN), is a stock I’ve followed for some time. 2020 hasn’t been good for the stock; from a January peak at around $94, the stock began a downward slide that only accelerated in March as the entire stock market moved into bear market territory. TSN did find a bottom at around $44 in mid-March and then rebound with the market to around $60; but from that point the stock has been hovering in a mostly sideways trading range. While other stocks in what I consider to be an industry – Food Products – that is nicely positioned as a defensive place for conservative investors have followed the market’s broader trend higher, TSN has been under pressure from negative press about factory conditions and labor unrest. Reports indicate the company is investing heavily to address safety concerns, and that is something that could be a drag on the bottom line; but at the same time the company’s most recent earnings report suggests that it remains well-positioned to navigate those near-term headwinds and still take advantage of broader economic trends that generally favor higher consumption of U.S. protein products. I think that means that TSN might have finally reached a point under current market conditions where its value proposition is simply too good to pass up.
Fundamental and Value Profile
Tyson Foods, Inc. is a food company, which is engaged in offering chicken, beef and pork, as well as prepared foods. The Company offers food products under Tyson, Jimmy Dean, Hillshire Farm, Sara Lee, Ball Park, Wright, Aidells and State Fair brands. The Company operates through four segments: Chicken, Beef, Pork and Prepared Foods. It operates a vertically integrated chicken production process, which consists of breeding stock, contract growers, feed production, processing, further-processing, marketing and transportation of chicken and related allied products, including animal and pet food ingredients. Through its subsidiary, Cobb-Vantress, Inc. (Cobb), the Company is engaged in supplying poultry breeding stock across the world. It produces a range of fresh, frozen and refrigerated food products. Its products are marketed and sold by its sales staff to grocery retailers, grocery wholesalers, meat distributors, warehouse club stores and military commissaries, among others. TSN has a current market cap of $22.1 billion.
Earnings and Sales Growth: Over the last twelve months, earnings declined by about -36%, while sales grew a little about 4.25%. In the last quarter, earnings dropped more dramatically, by -53.6% while sales were flat, but slightly positive at 0.67%. TSN operates with a modest margin profile; in the last twelve months, Net Income was 4.52% of Revenues and declined slightly to 3.34% in the last quarter.
Free Cash Flow: TSN’s Free Cash Flow is generally healthy, at $1.6 billion. That number has decreased from about $1.9 billion in June of 2018, but also increased in the last quarter from a little less than $1.3 billion. Its current level translates to a useful Free Cash Flow yield of about 7.27%.
Debt to Equity: TSN has a debt/equity ratio of .75, which is pretty conservative. Cash and liquid assets increased from about $170 million in June of 2018 to almost $500 million in the quarter prior, but declined somewhat to $437 million in the last quarter. The decline is a bit of a concern; it should be noted that TSN carries about $10.9 billion in long-term debt, which increased from about $9.7 billion in the quarter previous. That suggests that liquidity could be an issue in the event of a long-term shortfall in company’s operating profits. For now, however their balance sheet indicates operating profits are more than sufficient to service their debt.
Dividend: TSN pays an annual dividend of $1.68 per share, which at its current price translates to a dividend yield of 2.76%. TSN’s dividend has also increased from $1.20 per share in late 2018.
Price/Book Ratio: there are a lot of ways to measure how much a stock should be worth; but I like to work with a combination of Price/Book and Price/Cash Flow analysis. Together, these measurements provide a long-term, fair value target around $69 per share. That means the stock is moderately undervalued, with 13% upside from its current price, with a useful bargain discount at around $55.
Technical Profile
Here’s a look at the stock’s latest technical chart.
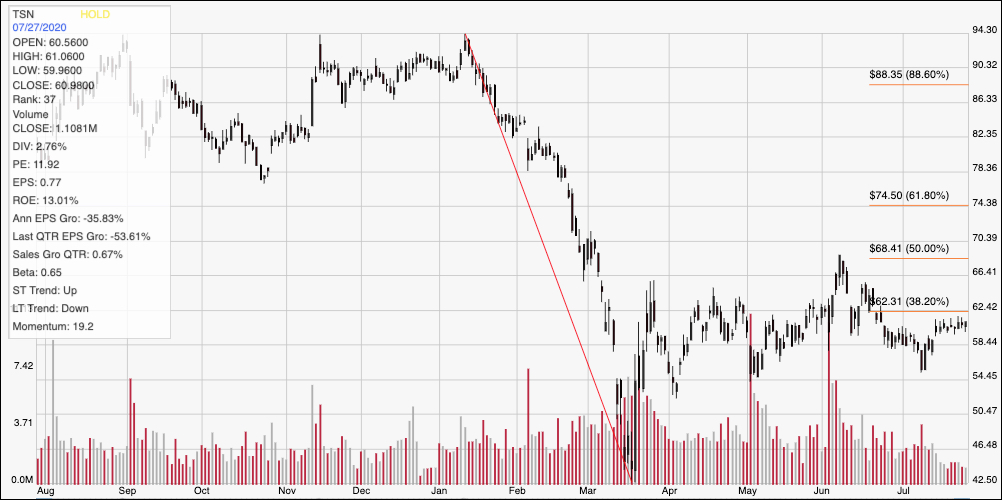
Current Price Action/Trends and Pivots: The diagonal red line outlines the stock’s downward trend beginning in January until mid-March. It also provides the baseline for the Fibonacci retracement lines shown on the right side of the chart. The stock’s rally into mid-April put the stock right at the 38.2% Fibonacci retracement line, which is sitting a little above $62 per share. The stock saw a temporary, bullish push to the 50% line in early June, but then fell back to range support around $55 in early July. In the last week, the stock’s trading range has narrowed even further, with resistance in line with the 38.2% retracement line at around $62, and support at around $59. A push above $62 could give the stock good bullish momentum to about $68.50, near the June peak and the 50% retracement line, while a drop below $59 has immediate downside to about $55, with even more room from there to the stock’s March low in the low $40’s. The stock is also coming up on its next earnings report on August 3, and which could provide an interesting catalyst to break the stock out of its tightening range.
Near-term Keys: There are a couple of metrics in TSN’s fundamental picture that bear watching; a continued deterioration of the company’s Net Income versus Revenues, along with continued pressure on cash and liquid assets could indicate that the company is operating less efficiently than it normally does. Otherwise, however, I think that global conditions, not merely related to coronavirus, but also to protein shortages around the world from other factors that pre-date the current pandemic, will generally continue to work in TSN’s favor. That means that the value proposition in TSN, along with the stock’s current price stabilization, could be very interesting. If you prefer to work with short-term term trading strategies, you could also use a break above $62 as a signal to buy the stock or work with call options, with useful profit targets at $68.50, or if bullish momentum continues, around $74.50. If, however the stock breaks down and drops below $59, consider shorting the stock or buying put options. In that case, use $55 as a quick-hit profit target, with additional downside below $50 if bearish momentum continues.