Some of the early-morning market commentary today focused on the fact that with yesterday’s close, the S&P 500 has moved above its pre-pandemic high – leading those participating to call for the “official” end to the shortest bear market in history. While that may technically be true, it doesn’t automatically mean that investors should take this as an “all-clear” signal. Moving into the late summer months and early fall, political uncertainty is likely to remain front and center, with upcoming general elections and presidential campaign rhetoric certain to become ever more divisive. Add to that continuing indications that economic growth is heavily skewed towards big business, and that small businesses are increasingly under pressure as COVID-19 risks remain, not to mention other issues like geopolitical tensions that are increasing yet again between the U.S. and China but that aren’t getting the same kind of attention from news media, and there are still lots of reasons to be cautious.
I think that a smart investor looks for way to hedge bullish bets in the stock market with more conservative, defensive-oriented positions. In the stock market, that generally means companies whose revenue streams are less likely to be negatively impacted by a broad decline in economic activity. Businesses in critical, always-needed industries, like Utilities and Food are good examples; another one that I like to pay attention to, especially under current conditions are Health Care Providers & Services. These include pharmacy companies, health insurers and hospital chains, and distributors, to name just a few types.
In the pharmaceutical distribution space, there are three primary companies, each of whom work under joint venture (JV) agreements with the three largest retail pharmacy chains in the United States. AmerisourceBergen (ABC) operates a JV with Walgreens Boots Alliance (WBA) to improve bargaining power versus generic drug manufacturers. For defensive purposes, I like to keep track of the major pharmacy companies, and I think it makes sense to do the same for the companies that they use to stock their shelves.
ABC is a stock that has followed the broad market’s trend to break above pre-pandemic highs and set new ones over the last month; in fact, since hitting a bear market low at around $72 in March, the stock has increased in value by nearly 42%. The stock is bolstered by some good indications of fundamental strength, including a very strong balance sheet and increasing Book Value. Given the way the stock has performed over the last five months, however, are those fundamental strong enough to make the stock a good value pick, or is this now just another of an increasing number of companies whose valuations are approaching risky levels? Let’s find out.
Fundamental and Value Profile
AmerisourceBergen Corporation is a pharmaceutical sourcing and distribution services company. The Company’s segments include Pharmaceutical Distribution and Other. The Company provides services to healthcare providers, and pharmaceutical and biotech manufacturers. As of June 30, 2016, the Pharmaceutical Distribution segment consists of two operating segments, including the operations of AmerisourceBergen Drug Corporation (ABDC) and AmerisourceBergen Specialty Group (ABSG), which distributes specialty drugs to their customers. Servicing healthcare providers in the pharmaceutical supply channel, the Pharmaceutical Distribution segment’s operations provide drug distribution and related services. The Other segment consists of the operations of various segments, including the AmerisourceBergen Consulting Services (ABCS), the World Courier Group, Inc. and the MWI Veterinary Supply, Inc. ABSG operates distribution facilities that focus primarily on complex disease treatment regimens. ABC has a market cap of $21 billion.
Earnings and Sales Growth: Over the last twelve months, earnings for ABC improved by 5.11%, while sales growth was flat, but positive at 0.28%. In the last quarter, earnings declined almost -23%, while sales dropped -4.33%. ABC’ margin profile is razor thin, with no room for error. Over the last twelve months, Net Income as a percentage of Revenues was 0.84%, and narrowed to .064% in the last quarter.
Free Cash Flow: ABC’s free cash flow over the trailing twelve month period was $1.25 billion, marking a decline from $1.9 billion in the quarter prior. The current figure translates to a modest Free Cash Flow Yield of 5.93%.
Debt to Equity: ABC has a debt/equity ratio of .91. This is generally conservative, and is confirmed by ABC’s balance sheet, which is a significant source of fundamental strength under current economic conditions. Total long-term debt is about $3.6 billion, while cash and liquid assets are about $3.4 billion. ABC’s strong cash position gives it a good buffer against its narrow operating profile and means there is no problem at present servicing its debt; however the current Net Income pattern also bears watching, as any continued, sustained deterioration in Net Income will work against the company’s strong cash position.
Dividend: ABC pays an annual dividend of $1.68 per share. At the stock’s current price, that translates to a dividend yield of about 1.63%.
Price/Book Ratio: there are a lot of ways to measure how much a stock should be worth; but I like to work with a combination of Price/Book and Price/Cash Flow analysis. Together, these measurements provide a long-term, fair value target around $107 per share. That means the stock is pretty fairly priced with just about 4% upside from the stock’s current price.
Technical Profile
Here’s a look at ABC’ latest technical chart.
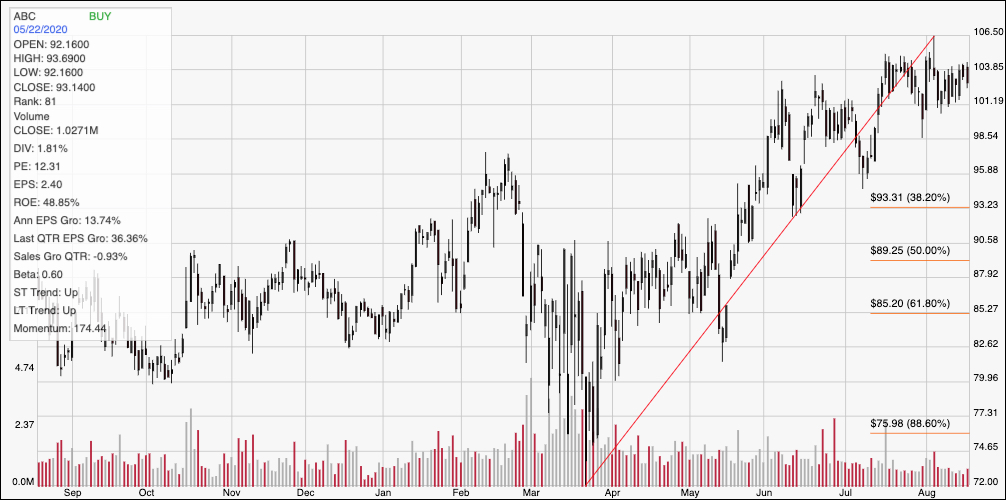
Current Price Action/Trends and Pivots: The diagonal red line marks the stock’s upward trend from March of this year to now. It also provides the baseline for the Fibonacci retracement lines shown on the right side of the chart. While the stock’s technical peak was earlier this month at around $106, its most current resistance level right now is around $104, which has also helped the stock begin to define a consolidation range at the top of the current trend. Support for the low end of the range is around $101. A break above $103 should see the stock test its $106 high at least, with additional short-term upside to about $108 if bullish momentum remains strong (based on the typical distance between previous resistance breaks and next resistance). A drop below $101 could see the stock fall to about $98.50 to next support, or possibly to $95 if bearish momentum accelerates.
Near-term Keys: If you prefer to work with short-term trading strategies, the best opportunity on the bullish side would come from a push above $103; that could be a good signal to buy the stock or work with call options with an eye on $106 as a near-term target. A bearish signal would come from a drop below $101; in that case you could consider shorting the stock or buying put options, using $98.50 to $95 as a good bearish profit target. I think that some of the challenges to ABC’s fundamental profile are reflective of broader economic concerns rather than any real problems in their business model or management approach; the company’s extremely strong balance sheet is a good counter to any negative perceptions that may come from other fundamental metrics. Unfortunately, however that doesn’t translate to a useful value proposition for the stock; it would actually need to fall to around $85 to offer a useful discount.