This week, I’ve turned my attention back to the Pharmacy industry – but specifically focusing on the distributors that supply the biggest pharmacies in the U.S. Understanding how some of those relationships work for a company you may have been following for a while can help identify new opportunities to think about. Over the last couple of years, companies in the Pharmacy industry have become more and more interesting to me, and a more consistent part of my investing method. This week I’ve started to add some of the companies that support the largest players in the industry, and it’s been useful way to increase my understanding of the Pharmacy stocks I’ve followed and used.
In the pharmaceutical distribution space, there are three primary companies, each of whom work under joint venture (JV) agreements with the three largest retail pharmacy chains in the United States. Mckesson Corp (MCK) operates a JV with Walmart (WMT) to improve bargaining power versus generic drug manufacturers. For defensive purposes, I like to keep track of the major pharmacy companies, and I think it makes sense to do the same for the companies that they use to stock their shelves.
Like a lot of stocks in the market, MCK followed the broad market’s rally from a bear market low in March to rally near to its pre-pandemic highs in early June. From that high at around $165 per share, however the stock has dropped back and settled into a consolidation range, with about $8 between support and resistance, and the stock currently sitting at the low end of the range. Like its brethren in this space, MCK has a good fundamental profile supported by a generally healthy balance sheet. Does that fundamental strength, combined with the stock’s price action over the last two months, also create a good value? Let’s find out.
Fundamental and Value Profile
McKesson Corporation is a healthcare supply chain management solution, retail pharmacy, community oncology and specialty care, and healthcare information technology company. The Company provides medicines, medical products and healthcare services by partnering with pharmaceutical manufacturers, providers, pharmacies, governments and other organizations in healthcare. It operates through three segments: United States Pharmaceutical and Specialty Solutions, European Pharmaceutical Solutions and Medical-Surgical Solutions. The United States Pharmaceutical and Specialty Solutions segment distributes pharmaceutical and other healthcare related products and provides pharmaceutical solutions to life sciences companies. European Pharmaceutical Solutions segment provides distribution and services to wholesale, institutional and retail customers. Medical-Surgical Solutions segment distributes medical-surgical supplies and provides logistics and other services to healthcare providers. MCK has a market cap of $24.5 billion.
Earnings and Sales Growth: Over the last twelve months, earnings for MCK declined by -16.3%, while sales were flat, but slightly negative, at -0.09%. In the last quarter, earnings declined almost -4.88%, while sales dropped -35.13%. MCK’s margin profile is razor thin – but that seems to be a common theme for this industry group. Over the last twelve months, Net Income was -0.4% of Revenues, but improved to 0.8% in the last quarter. That’s generally a positive, but still leaves no room for error. Given the declining earnings and revenues trends, this is an element that bears monitoring in the quarters ahead, as even a little margin improvement, relatively speaking could give the company a bigger buffer to work with.
Free Cash Flow: MCK’s free cash flow over the trailing twelve month period was $2.8 billion, marking a decline from $3.8 billion in the quarter prior. The current figure translates to a healthy Free Cash Flow Yield of 11.57%.
Debt to Equity: MCK has a debt/equity ratio of 1.42. This is a very high number, implying that MCK is very highly leveraged; this is also pretty common for this industry group. The company’s balance sheet is a source of fundamental strength under current economic conditions. Total long-term debt is about $8 billion, while cash and liquid assets are about $2.6 billion. MCK’s healthy cash position gives it a good buffer against its narrow (albeit improving) operating profile and means there should be no problem at present servicing its debt; however the current Net Income pattern also bears watching, as a shift in the quarterly metric to a negative number will work against the company’s cash position. It is also worth noting that at the end of March, MCK’s liquidity was markedly better, with cash and liquid assets of a little over $4 billion.
Dividend: MCK pays an annual dividend of $1.68 per share. At the stock’s current price, that translates to a dividend yield of about 1.11%.
Price/Book Ratio: there are a lot of ways to measure how much a stock should be worth; but I like to work with a combination of Price/Book and Price/Cash Flow analysis. Together, these measurements provide a long-term, fair value target around $135 per share. That means the stock is overvalued, with about -11% downside from the stock’s current price.
Technical Profile
Here’s a look at MCK’s latest technical chart.
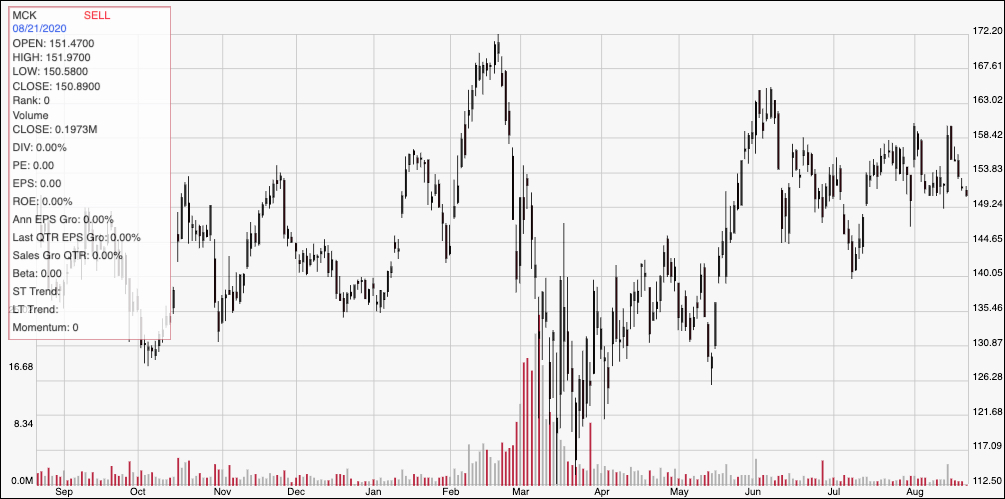
Current Price Action/Trends and Pivots: The chart above displays the last year of price activity for MCK. The upward trend from March to now is easy to see. The stock peaked in June at around $164 per share before dropping and beginning to consolidate. The range between support and resistance has been narrowing over the last month, with support sitting between $149 and $150, and resistance at the stock’s last pivot high, reached about a week ago at $160 per share. The stock is very near support right now, which means that if it can pivot and start to bounce higher, there is about $10 of room to work with, and if bullish momentum strengthens, it could move as high as the June peak at around $164, and possibly even test its 52-week high at around $172. A drop below $150 should find next support at around $144.50, with $140 within sight if bearish momentum accelerates.
Near-term Keys: If you prefer to work with short-term trading strategies, and you’re willing to be aggressive, a bounce off support at $150 could be a good signal to buy the stock or to work with call options, using $160 as a good initial profit target. If the stock drops below $150, you could take that as a signal to short the stock or buy put options, using $144.50 as a good initial profit target for a bearish trade. I think that some of the challenges to MCK’s fundamental profile – declining Free Cash Flow as well as liquidity in the form of cash – are reflective of broader economic concerns rather than any real problems in their business model or management approach; the company’s solid balance sheet is a good counter to any negative perceptions that may come from other fundamental metrics. Unfortunately, however that doesn’t translate to a useful value proposition for the stock; it would actually need to fall to around $108 to offer an attractive discount.