This morning I was a little surprised to see a couple of reports that had analysts saying that since there is no precedent for current market conditions, there is no limit to how much higher the market can go. That kind of capitulation from the analyst side of things – essentially saying “all the rules have changed” – is the kind of thing I haven’t seen since the late 1990’s, when the dot-com movement was in full boom mode. Remember how that story ended?
I’m not saying that current market conditions are like anything we’ve seen in the past – because the truth is that seeing the market rally from a bear market bottom back to pre-bear highs, and even break above that mark in just a few months’ time is truly remarkable. I am saying that I don’t agree that the methods we’ve used to measure market values – including the points where the market is overvalued and due for some kind of contraction – have been rendered obsolete, because the truth is that while a lot of stocks, especially in the tech sector have been defying those traditional models, there are plenty of other stocks in other important segments of the economy that are offering attractive opportunities – even according to those old, “outdated” valuation models.
Tyson Foods Inc. (TSN), is a stock I’ve followed for some time. 2020 hasn’t been good for the stock; from a January peak at around $94, the stock began a downward slide that only accelerated in March as the entire stock market moved into bear market territory. TSN did find a bottom at around $44 in mid-March and then rebound with the market to around $60; but from that point the stock has been hovering in a mostly sideways trading range. While other stocks in what I consider to be an industry (Food Products) that is nicely positioned as a defensive place for conservative investors have followed the market’s broader trend higher, TSN has been under pressure from negative press about factory conditions and labor unrest. The company has invested heavily to address safety concerns, and that is something that earlier this year appeared to act as a drag on the bottom line; but the company’s most recent earnings report suggests not that it continues to navigate near-term, coronavirus-driven headwinds, but that it has benefited from increases in protein demand in the U.S. and overseas. I think that means that TSN might have finally reached a point under current market conditions where its value proposition is simply too good to pass up.
Fundamental and Value Profile
Tyson Foods, Inc. is a food company, which is engaged in offering chicken, beef and pork, as well as prepared foods. The Company offers food products under Tyson, Jimmy Dean, Hillshire Farm, Sara Lee, Ball Park, Wright, Aidells and State Fair brands. The Company operates through four segments: Chicken, Beef, Pork and Prepared Foods. It operates a vertically integrated chicken production process, which consists of breeding stock, contract growers, feed production, processing, further-processing, marketing and transportation of chicken and related allied products, including animal and pet food ingredients. Through its subsidiary, Cobb-Vantress, Inc. (Cobb), the Company is engaged in supplying poultry breeding stock across the world. It produces a range of fresh, frozen and refrigerated food products. Its products are marketed and sold by its sales staff to grocery retailers, grocery wholesalers, meat distributors, warehouse club stores and military commissaries, among others. TSN has a current market cap of $22.5 billion.
Earnings and Sales Growth: Over the last twelve months, earnings declined by about -4.76%, while sales drp[[ed -7.93%. In the last quarter, earnings improved, increasing 81.82% while sales were -7.95% lower. TSN operates with a modest, but improving margin profile; in the last twelve months, Net Income was 4.26% of Revenues and strengthened to 5.26% in the last quarter.
Free Cash Flow: TSN’s Free Cash Flow is healthy and getting stronger, at a little less than $2.5 billion. That number has increased from about $1.6 billion in the last quarter. Its current level translates to a useful Free Cash Flow yield of about 10.68%.
Debt to Equity: TSN has a debt/equity ratio of .75, which is pretty conservative. Cash and liquid assets increased from about $170 million in June of 2018 to about $437 million in the quarter prior, but improved dramatically in the last quarter to $1.36 billion. TSN carries about $11.2 billion in long-term debt, which increased from about $9.7 billion two quarters ago. For now, all indications are that there should be no problem servicing debt, however a decline in Net Income could erode liquidity fairly quickly given the high debt level.
Dividend: TSN pays an annual dividend of $1.68 per share, which at its current price translates to a dividend yield of 2.68%. TSN’s dividend has also increased from $1.20 per share in late 2018.
Price/Book Ratio: there are a lot of ways to measure how much a stock should be worth; but I like to work with a combination of Price/Book and Price/Cash Flow analysis. Together, these measurements provide a long-term, fair value target around $85 per share. That means the stock is nicely undervalued, with 38% upside from its current price.
Technical Profile
Here’s a look at the stock’s latest technical chart.
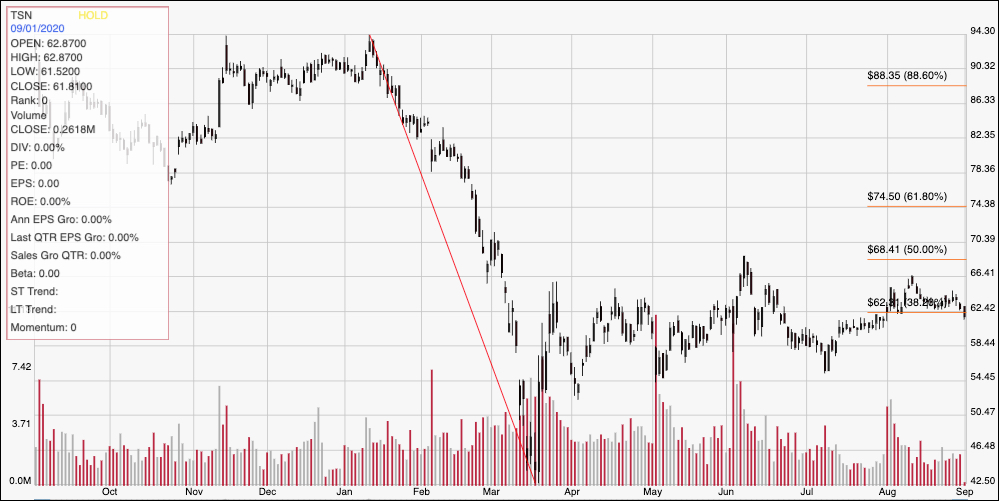
Current Price Action/Trends and Pivots: The diagonal red line outlines the stock’s downward trend beginning in January until mid-March. It also provides the baseline for the Fibonacci retracement lines shown on the right side of the chart. The stock’s rally into mid-April put the stock right at the 38.2% Fibonacci retracement line, which is sitting a little above $62 per share. The stock saw a temporary, bullish push to the 50% line in early June, but then fell back to range support around $55 in early July. Through most of August, the stock has set a trading range with support at around $62 and resistance a little above $66. More recently, the stock has dropped below the 38.2% retracement line and appears to be breaking immediate support. Next support should be in the $58.50 range, with $55 after that if bearish momentum picks up. A push back above $62 could be a good sign the stock’s momentum could push it back to the $66 level, with next resistance around $68.50 where the 50% retracement line sits.
Near-term Keys: TSN’s value proposition is much better now than it was as recently as a month ago, with improving fundamentals that I think make it hard to ignore as a good long-term investment. I also think that global conditions, not merely related to coronavirus, but also to protein shortages around the world from other factors that pre-date the current pandemic, will generally continue to work in TSN’s favor. If you prefer to work with short-term term trading strategies, you could also use a break above $62 as a signal to buy the stock or work with call options, with useful profit targets at $66, or if bullish momentum continues, around $68.50. The stock’s current drop below $62 looks like a signal to consider shorting the stock or buying put options, with $55 as a quick-hit profit target, and additional downside below $50 if bearish momentum continues.