We’re moving into the last month of the third quarter of 2020, and it looks like the market is finally letting off some steam. The NASDAQ is down nearly -10% in the last two days, leading the major indices lower. It seems apparent that the practically uninterrupted increases of the last few weeks have finally reached levels that have short-term traders reading to take profits off the table. It’s a drawdown that could certainly be argued has been a long time coming.
Some might look at recent economic reports, including earnings reports this week from large-cap stocks and wonder what is going on. Unemployment numbers released this morning were stronger than expected, manufacturing activity this week showed measurable improvements from the month prior, and the Fed continues to indicate that they will remain accommodative – even to the point of diverging from using 2% as a hard signal line for interest rate changes to a moving average over time. I think it’s important to remember that drawdowns in the market are generally healthy; while this one has happened much more quickly than normally expected, this year has proven that anything is possible. In the near-term, this drawdown – which is quickly dropping into technical correction territory – should provide an opportunity for the broad market to find a useful support point at which to set the stage for a resumption of the overall trend. Where that support will be, and when the market will start going up again is the part, of course that is anybody’s guess.
As an investor, I think that means there is going to continue to a clear delineation between where the best investing opportunities lie. Companies with the girth, and the balance sheets to ride through turbulent economic times continue to be the most likely to provide the best probabilities of success. That’s one of the reasons i continue to rely on the fundamental and value-driven principles that my core investing system is built on. It doesn’t mean there aren’t opportunities in lesser-known names; but it forces me to scrutinize the details of those companies very carefully to determine if they have the resources necessary to manage uncertainty and come out on the other side.
One of the reasons the Industrial segment is interesting is because as economic activity picks up, there should generally be an increase in demand for many of the companies in this space. A healthy real estate market, for example – and there are indications that real estate has survived remarkably well so far in spite of other pressures – means that home builders can keep new projects going, which usually is good news for Machinery stocks like Paccar Inc. (PCAR). Real estate and construction is hardly the only place PCAR operates, of course; it is really just one example where better-than-expected strength should give this company’s business a lift.
That hope is part of the reason that PCAR has followed the Industrial sector’s move higher. From a March bottom at around $49, the stock nearly doubled in price by early August, hitting a peak at around $91 per share before falling back to its current price around $85. The company’s balance sheet so far is holding up well, which is also a positive. Does the stock offer a third compelling reason to work with it on a long-term basis by also offering a compelling value proposition, or has the stock’s rally pushed it past the point of useful value? Let’s find out.
Fundamental and Value Profile
PACCAR Inc (PACCAR) is a technology company. The Company’s segments include Truck, Parts and Financial Services. The Truck segment includes the design, manufacture and distribution of light-, medium- and heavy-duty commercial trucks. The Company’s trucks are marketed under the Kenworth, Peterbilt and DAF nameplates. It also manufactures engines, primarily for use in the Company’s trucks, at its facilities in Columbus, Mississippi; Eindhoven, the Netherlands, and Ponta Grossa, Brazil. The Parts segment includes the distribution of aftermarket parts for trucks and related commercial vehicles. The Financial Services segment includes finance and leasing products and services provided to customers and dealers. Its Other business includes the manufacturing and marketing of industrial winches. The Company operates in Australia and Brazil and sells trucks and parts to customers in Asia, Africa, Middle East and South America. PCAR has a current market cap of about $29.7 billion.
Earnings and Sales Growth: Over the last twelve months, earnings have declined almost -76%, while revenues dropped about -54%. In the last quarter, earnings were -58.25%, while revenues dropped -40.6%. The company’s margin profile is solid, but has shown some deterioration in the last quarter; over the last twelve months, Net Income was 7.95% of Revenues, a decreasing to 4.82% in the last quarter.
Free Cash Flow: PCAR’s free cash flow is healthy, at about $1.8 billion over the last year. That translates to a useful Free Cash Flow Yield of 6.11%. It has also increased from about $1.63 billion at the end of last year.
Debt/Equity: The company’s Debt/Equity ratio is .76, reflecting a conservative approach to leverage. PCAR’s balance sheet shows $4.275 billion in cash and liquid assets in the last quarter versus about $7.4 billion in long-term debt. The company’s generally healthy operating profile, along with a solid cash position means that the company has good liquidity and should have no problems servicing the debt they have.
Dividend: PCAR’s annual divided is $1.28 per share and translates to a yield of about 1.5% at the stock’s current price. The dividend also appears safe, running at less than 25% of PCAR’s earnings per share.
Price/Book Ratio: there are a lot of ways to measure how much a stock should be worth; but I like to work with a combination of Price/Book and Price/Cash Flow analysis. Together, these measurements provide a long-term, fair value target around $86 per share. That means the stock is fairly valued, running just 1% below that fair value target price. That also puts PCAR’s value price down at around $69 per share.
Technical Profile
Here’s a look at the stock’s latest technical chart.
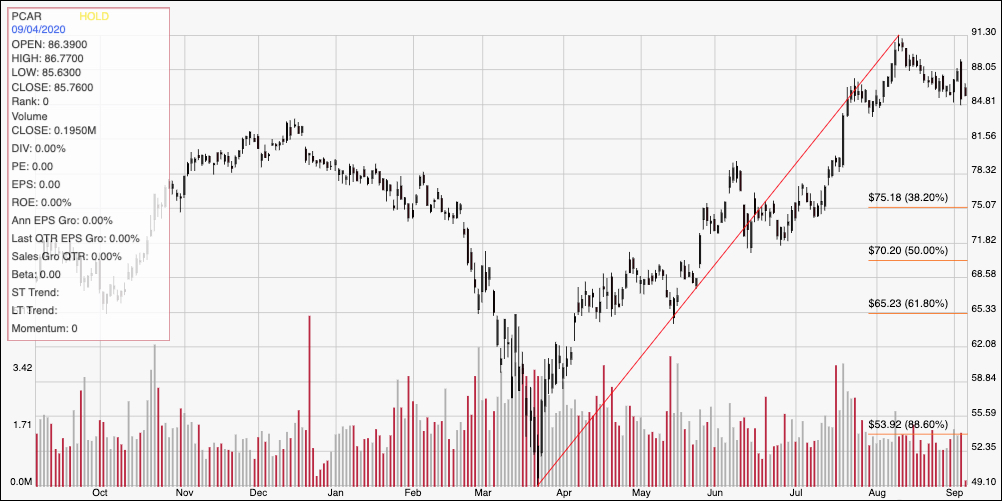
Current Price Action/Trends and Pivots: The chart above shows the last year of price activity for PCAR. The red diagonal line traces the stock’s upward trend from March to its peak at around $91 at the beginning of August. It also provides the baseline for the Fibonacci retracement lines shown on the right side of the chart. From a peak in December 2019 at around $83.50, the stock declined sharply to a March low at around $49 per share before rallying to its August peak. It has dropped off of that point, marking resistance at $91 and support at around $85. A drop below $85 could see the stock fall to about $79, with $75 below that offering next support in line with the 38.2% retracement line. A push above immediate resistance around $88 should give the stock enough momentum to retest its $91 high.
Near-term Keys: For the most part, I really like PCAR’s fundamentals. Their balance sheet is healthy, but at the current price, it does not represent a value or any kind of bargain. That doesn’t mean there isn’t upside for growth-oriented investors to be had; only that it is already trading at valuations that are less attractive for bargain hunters. It also means that the best possibilities lie on the short-term side, via momentum-based trades. A break above resistance at $88 could offer an interesting opportunity to buy the stock or work with call options, with an eye on $91 as a useful, near-term profit target. If the stock drops below $85, consider shorting the stock or buying put options, using $79 as a practical exit target on a bearish trade.