If you read my highlights in this space on a regular basis, you’ve seen me highlight stocks in the semiconductor industry pretty frequently. It’s an interesting segment of the market to me for a number of different reasons. Over the last decade-plus, it’s been one of the highest-performing pockets of the market, arguably one of the biggest catalysts for the bull run that didn’t see any kind of meaningful lapse or drawdown until 2018. In 2018 and 2019, the industry was among the most sensitive to geopolitical pressure, especially as it relates to trade, but following a pandemic-induced drop with the rest of the market to new bear market lows, the industry generally followed the rest of the Tech sector to a fresh set of new highs that were even above pre-pandemic levels.
A big part of that rally was a reflection of the corporate America shift to remote-enabled workforce solutions, such as web conferencing, virtual private networks and cloud-based services and solutions, which enabled many workers to keep working even as much of the global economy was being shut down due to shelter-in-place orders to limit the spread of COVID-19. That shift kept a lot of businesses running even while trying to adjust a difficult economic conditions, and is perhaps the biggest reason the Tech sector has been one of the top performers this year, with semiconductors generally following along with that trend.
Intel Corp (INTC) is undoubtedly the 600-lb gorilla of all semiconductor stocks, and so if you want to evaluate the industry in a practical sense, you really have to be willing to start here. I think INTC is a company with an interesting story to tell. For most people, Intel is a name that automatically makes you think – understandably – about PC’s, which is of course where the company carved out their dominant market position. If you stop your analysis there, I don’t think you’ll find much to hang your hat on about their future growth prospects; intense competition among semiconductors in this pocket of their market has eroded much of INTC’s market share. The interesting thing, in my opinion is in the way INTC is moving to identify the next generation of growth opportunities by investing heavily in cloud processing and storage technology as well as 5G mobile processing.
Those investments are expected by most analysts to provide the bulk of their revenue and earnings growth in the foreseeable future. Already a leader in the semiconductor space, it’s pretty natural to expect INTC to maintain its leadership position in these additional markets. Does that mean the stock is a good long-term opportunity? Perhaps because of gains made by some of its most direct competitors, INTC’s stock performance has lagged the industry, sector and market; year to date the stock is down -17%, and sits only a few dollars above its March, bear-market lows. That performance belies the company’s fundamental strength, which includes very healthy Free Cash Flow, a robust operating profile, and a very solid balance sheet. Does that also mean the stock could be one of the best semiconductor value plays in the market? Let’s find out.
Fundamental and Value Profile
Intel Corporation is engaged in designing and manufacturing products and technologies, such as the cloud. The Company’s segments are Client Computing Group (CCG), Data Center Group (DCG), Internet of Things Group (IOTG), Non-Volatile Memory Solutions Group (NSG), Intel Security Group (ISecG), Programmable Solutions Group (PSG), All Other and New Technology Group (NTG). It delivers computer, networking and communications platforms to a set of customers, including original equipment manufacturers (OEMs), original design manufacturers (ODMs), cloud and communications service providers, as well as industrial, communications and automotive equipment manufacturers. It offers platforms to integrate various components and technologies, including a microprocessor and chipset, a stand-alone System-on-Chip (SoC), or a multichip package. The CCG operating segment includes platforms that integrates in notebook, two in one systems, desktop computers for consumers and businesses, tablets, and phones. INTC’s current market cap is about $211 billion.
Earnings and Sales Growth: Over the last twelve months, earnings increased about 16% while sales rose by 19.5%. In the last quarter, earnings decreased a little over -15%, while sales were flat, but somewhat negative at -0.5%. INTC operates with a very healthy margin profile; Net Income versus Revenues over the past year was about 30%, and narrowed somewhat in the last quarter to a little under 26%. That operating profile gives INTC a lot of flexibility and is a definite source of strength.
Free Cash Flow: INTC’s free cash flow is healthy and improving; in the last quarter, it came in at $21.9 billion – marking an improvement from $13.6 billion a year ago and about $12.5 billion at the end of the first quarter of 2019. That translates to a Free Cash Flow Yield of about 10.38%. The percentage is attractive, but the size of the actual number is a reflection of the company’s operating strength, which should serve it well even if broad economic uncertainty continues.
Debt to Equity: INTC has a debt/equity ratio of .44. This is a conservative number. The company’s balance sheet indicates that operating profits are adequate to service their debt, with $25.8 billion in cash and liquid assets versus $36 billion in long-term debt. They have a lot of debt, but with a healthy operating margin profile along with a sizable cash position, servicing their debt shouldn’t be a problem.
Dividend: INTC pays an annual dividend of $1.32 per share, which translates to a yield of 2.66% at the stock’s current price.
Price/Book Ratio: there are a lot of ways to measure how much a stock should be worth; but I like to work with a combination of Price/Book and Price/Cash Flow analysis. Together, these measurements provide a long-term, fair value target around $59 per share. That means that INTC is trading at a 19% discount right now, which makes the stock pretty interesting.
Technical Profile
Here’s a look at the stock’s latest technical chart.
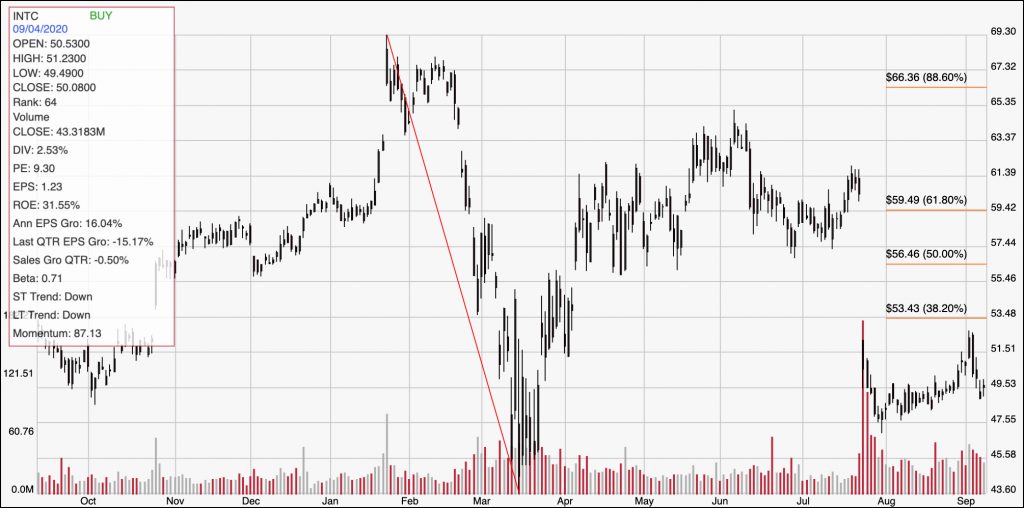
Current Price Action/Trends and Pivots: The chart above displays the last year of price activity for INTC. The red diagonal line traces the stock’s drop to a bear market low in March at around $44; it also provides the baseline for the Fibonacci retracement line on the right side of the chart. After following the sector to a nice peak at around $63, the stock gapped back low at the end of July to a low at around $47 following an earnings report the market didn’t take favorably. After climbing back to a high a little below the 38.2% retracement line around $52, the stock dropped back again amid this week’s broad sell off and is now just a little below $50. Support is around $47.50, with resistance between $52 and $53.50. The stock appears to be bouncing off of support, which means that a continued upward push should see it retest that recent high around $52. A drop below $47.50 should see the stock fall back to its March lows around $44.
Near-term Keys: The narrow ranges between the stock’s support and resistance levels could offer some useful trading opportunities – provided you’re willing to work with quick profits rather than attempting to maximize the stock’s trends. If the stock continues to push higher, consider buying the stock or working with call options, using $52 to $53.50 as a bullish exit target. A drop below $47.50 would be a strong signal to think about shorting the stock or buying put options, with $44 acting as a good profit target on a bearish trade. What about the stock’s value proposition? The company’s solid fundamental profile, with a very healthy balance sheet, combined with its historical price discount are enough to call the stock an interesting value proposition at its current price.