I’ve written quite a bit in this space about my opinion that the Consumer Staples sector – and more specifically, stocks in the Food Products and Food and Staples Retail industries – are smart places to find good values in today’s market. That’s because most of the stocks in these industries are benefitting from stay-at-home, eat-at-home trends that are a product of COVID-19 – but they don’t generally get a lot of investor attention because they just aren’t very “sexy.” The dichotomy between fundamental strength and lack of investor demand means that while these industries have collectively performed pretty well throughout the year, there are still a lot of stocks to work with at very nice prices.
As is always the case, you have to be careful about casting your net too wide when it comes to industry or sector-based generalizations. A good example is the Technology sector, which has not too surprisingly led the market’s rally from March bear market lows. Many of the biggest names in the sector have led the way, and in particular companies that were positioned on the right side of remote workforce, collaboration, and cloud-based services at the beginning of the year have clearly been at the head of the pack. That might make a pure contrarian shy away from buying stocks in the industry – but the truth is that there are still some big, established names in that sector that offer very interesting value propositions.
The same principle holds true, but in reverse fashion for the Food Products industry. While there are a lot of good companies trading at nice enough prices to fit my criteria for a good, long-term, value-based investment, there are others that investors have pushed to aggressive new highs that aren’t supported by their underlying fundamentals. One of those names is Archer-Daniels-Midland Co. (ADM) – one of the biggest U.S. processor of agricultural goods. The company has benefitted throughout the year by the U.S. consumer push to stock up pantries, including trends towards plant-based proteins. Looking ahead, they also appear to be well-positioned to benefit from soybean supply chain problems in South America, while demand for soybean exports from China should start increasing to fill that country’s own shortages. Those are probably good reasons that the stock has increased from a March low at around $29 to a 52-week high last week at around $50; but the truth is that even with those positive elements in place, ADM is a company with some big holes in its fundamental profile, including negative Free Cash Flow and deteriorating liquidity. ADM is an interesting company to keep on a watchlist – but it’s hard to make a value-based argument for this stock.
Fundamental and Value Profile
Archer-Daniels-Midland Company is a processor of oilseeds, corn, wheat, cocoa and other agricultural commodities. The Company manufactures protein meal, vegetable oil, corn sweeteners, flour, biodiesel, ethanol, and other food and feed ingredients. Its segments include Agricultural Services, which utilizes its United States grain elevator, global transportation network and port operations to buy, store, clean and transport agricultural commodities, such as oilseeds, wheat, milo, oats, rice and barley, and resells these commodities primarily as food and feed ingredients and as raw materials for the agricultural processing industry; Corn Processing, which is engaged in corn wet milling and dry milling activities; Oilseeds Processing, which includes global activities related to the origination, merchandising, crushing and further processing of oilseeds; Wild Flavors and Specialty Ingredients products, which include flavors, sweeteners and health ingredients; Other, and Corporate. ADM’s current market cap is about $27 billion.
Earnings and Sales Growth: Over the last twelve months, earnings increased more than 41.6%, while sales were flat but somewhat negative, by -0.10%. In the last quarter, earnings improved nearly 33% while sales increased 8.76%. The company operates with a very narrow margin profile, which isn’t that uncommon in its industry. Net Income versus Revenues over the past year is 2.72%, but improved somewhat in the last quarter to 2.88%.
Free Cash Flow: ADM’s free cash flow is negative, by about -$3.9 billion, and that is a big red flag; it is an indication that the company’s financial flexibility is becoming more restrictive. This is a number that, like Net Income, has been negative since the beginning of 2017, only briefly touching positive territory in the first quarter of 2018. It is worth noting that this number has improved from earlier in the year at around -$6.2 billion, and -$4.8 billion in the quarter prior.
Debt to Equity: ADM has a debt/equity ratio of .45. This is a conservative number. The company’s balance sheet indicates that while margins are tight, operating profits are adequate to service their debt, with about $6.2 billion in cash and liquid assets (down from $9.8 billion in the quarter prior, but still above the $5.3 billion marked at the beginning of the year) versus more than $8.6 billion in long-term debt; however ADM’s negative Free Cash Flow suggests that the company is having to rely largely on cash to service its debt. The longer that condition persists, the more likely liquidity is to become a question mark.
Dividend: ADM pays an annual dividend of $1.44 per share, which translates to an attractive yield of 2.95%. ADM is a company that has raised its dividend every year for the last 45 years, which implies that the risk the dividend will be cut or eliminated is low.
Price/Book Ratio: there are a lot of ways to measure how much a stock should be worth; but I like to work with a combination of Price/Book and Price/Cash Flow analysis. Together, these measurements provide a long-term, fair value target around $30 per share. That means that ADM is very overvalued, with about -39% downside from its current price. That also puts ADM’s bargain price at around $24.
Technical Profile
Here’s a look at the stock’s latest technical chart.
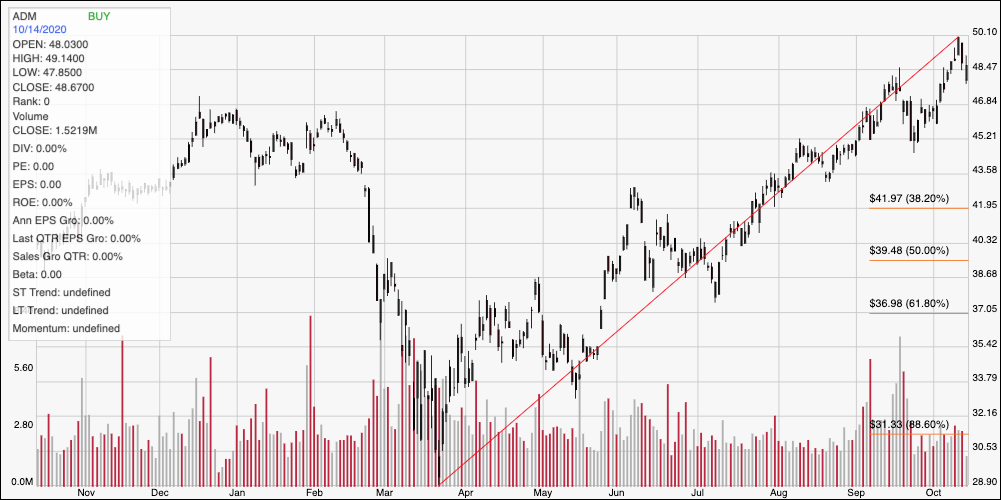
Current Price Action/Trends and Pivots: The chart above displays the stock’s price activity for the past year. The diagonal red line traces the stock’s upward trend from its March low at around $29 to its recent peak at around $50. It also provides the baseline for the Fibonacci retracement lines shown on the right side of the chart. The stock has retraced a bit in the last few days from that $50 high point, and should find new support at around $47, where previous resistance sat at the beginning of the month. A drop below that level should find next support at around $45, but given the strength of the upward trend, the stock would probably not mark a bearish trend reversal unless it drops below the $42 support level marked by the 38.2% Fibonacci retracement line. Immediate resistance is back at the recent 52-week high at around $50; a break above that mark should give the stock room to rally to somewhere between $52 and $53 based on the distance between the last resistance break earlier this month and $50.
Near-term Keys: There is really no way to describe ADM a good value right now. The strength of the stock’s upward trend also makes any kind of short-term, bearish set up a very low probability kind of trade. In looking at short-term trades, I wouldn’t look for opportunities to short the stock or buy put options unless the stock drops below the $42 level. With the stock currently retracing back from its recent high, the best setup is to look for a bounce off of support, which should occur around $47, but could also come around $45. A move higher from either of those levels could mark an interesting opportunity to buy the stock or work with call options, using $50 as a good, quick-hit profit target on a short-term trade, with room to ride the stock to about $52 or $53 if bullish momentum accelerates.