Even before the coronavirus pandemic started to take down entire sectors of the economy beginning in February, the Auto industry was experiencing quite a bit of bearish pressure. Sales were down globally, reflecting economic slowing in various parts of the world as well as the effects of an extended trade war between the U.S. and China that held investor’s attention through most of 2018 and all of 2019. The completion of a Phase One trade deal in late 2019 seemed to give reason for optimism that a turnaround for the industry was just around the corner – until the global economy ground to a halt amid massive quarantine and shelter-in-place orders that closed down businesses and sent consumers home to limit the spread of COVID-19. The news hasn’t really gotten better since then for the industry, with sales remaining tepid through the summer. With a new wave of infections across the U.S. and Europe, it doesn’t look like the industry is likely to see any late year relief, either.
BorgWarner Inc. (BWA) is an example of a U.S. company that provides parts and services to major auto manufacturers. At the beginning of this year, the company also announced it had entered into an agreement to acquire Delphi Technologies, which gives the company exposure and opportunity in hybrid and electronic vehicles, where media buzz and many growth forecasts are the highest. BWA agreed to pay $3.3 billion for the deal, which is a big price, and depending on the analyst, could be an onerous premium to pay to gain entry into this segment. The acquisition also involved BWA taking on about $2.1 billion in new, long-term debt to finance the deal, which along with the high price paid has some analysts suggesting that while the deal was a good strategic, long-term fit, BWA paid too much.
Even before that deal was announced, the stock began a strong downward trend in November of 2019, dropping from a peak at around $47 to a March low at around $17 per share. The remarkable thing about BWA is that while the pandemic has absolutely had an impact on the company, its last couple of earnings reports show that the company has so far actually managed to absorb the initial blow better than most. The stock has rallied by a factor of a little less than 2.5 times above that $17 low to a high in September around $42, but has dropped back from that point by about -14% to its current level. Given the industry’s slim prospects for growth in 2020 and 2021 according to most forecasts, and the spectre of continued high levels of unemployment into 2021, it begs the question: does BWA still offer a useful value opportunity, or is this a bad time to bet on a stock that already made a big move this year but now could be building bearish momentum?
Fundamental and Value Profile
BorgWarner Inc. is engaged in providing technology solutions for combustion, hybrid and electric vehicles. The Company’s segments include Engine and Drivetrain. The Engine segment’s products include turbochargers, timing devices and chains, emissions systems and thermal systems. The Engine segment develops and manufactures products for gasoline and diesel engines, and alternative powertrains. The Drivetrain segment’s products include transmission components and systems, all-wheel drive (AWD) torque transfer systems and rotating electrical devices. The Company’s products are manufactured and sold across the world, primarily to original equipment manufacturers (OEMs) of light vehicles (passenger cars, sport-utility vehicles (SUVs), vans and light trucks). The Company’s products are also sold to other OEMs of commercial vehicles (medium-duty trucks, heavy-duty trucks and buses) and off-highway vehicles (agricultural and construction machinery and marine applications. BWA has a current market cap of about $8.9 billion.
Earnings and Sales Growth: Over the last twelve months, earnings decreased -8.33%, while revenues managed to improve 1.69%. In the last quarter, earnings increased much more than expected, by a little over 728.5% (not a typo) while sales increased 77.7%. The company’s margin profile had narrowed through most of the year, which isn’t surprising given broader industry trends right now, but appears to be stabilizing; over the last twelve months Net Income as a percentage of Revenues was 4.11%, and increased slightly to 4.38% in the last quarter.
Free Cash Flow: BWA’s free cash flow is adequate, at $573 million over the last year, marking an improvement from $460 million in the quarter prior. It should also be noted, however that this number declined from about $750 million at the beginning of the year. The current number translates to a modest Free Cash Flow Yield of 6.7%.
Debt to Equity: A has a debt/equity ratio of .57. This is a very manageable number, that suggests the company should have no trouble servicing their debt. Their balance sheet shows $2.1 billion in cash and liquid assets against about $2.8 billion in long-term debt. The long-term number is made up mostly of debt assumed at the beginning of the year ahead of finalization of its Delphi acquisition; in spite of some opinions that management paid too much to close the deal debt service shouldn’t present a problem.
Dividend: BWA’s annual divided is $.68 per share and translates to a yield of 1.91% at the stock’s current price. It is also noteworthy that BWA has maintained its dividend in a year where other companies are cutting or suspending their dividend payouts.
Price/Book Ratio: there are a lot of ways to measure how much a stock should be worth; but I like to work with a combination of Price/Book and Price/Cash Flow analysis. Together, these measurements provide a long-term, fair value target around $42 per share. That means that BWA is undervalued by 15% from its current price around $36.50. It is worth noting that in August, my price target for this stock was around $47, which means the value proposition is shifting downward.
Technical Profile
Here’s a look at the stock’s latest technical chart.
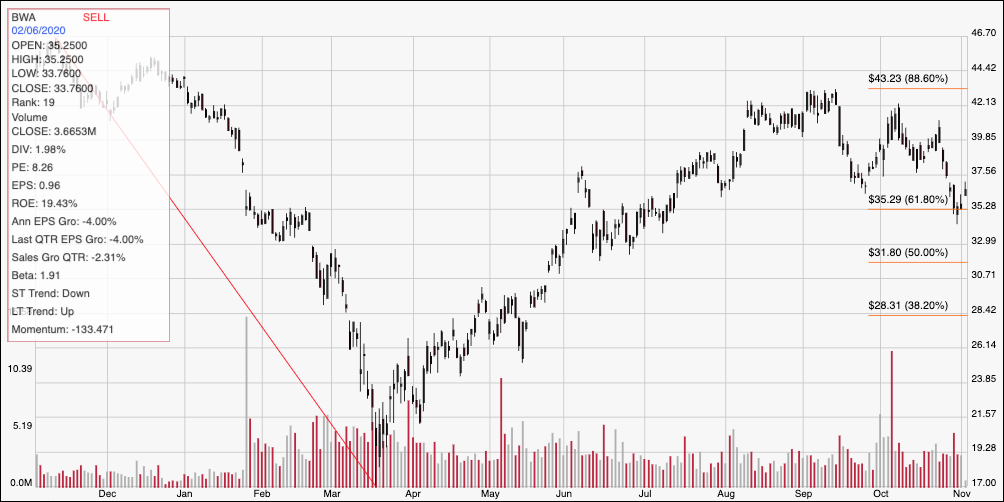
Current Price Action/Trends and Pivots: The red diagonal line measures the length of the stock’s downward trend since November 2019, and also informs the Fibonacci trend retracement lines shown on the right side of the chart. Since bottoming in Marc at around $17, BWA has staged an impressive upward trend, pushing above every retracement line except the 88.6% line at around $43 and acted as strong resistance in early September. The stock’s momentum from that point has been clearly bearish, with the stock recently finding new support at around $35, inline with the 61.8% retracement line. Immediate resistance is between $37.50 and $38. A push above $38 could give the stock room to retest highs between $42 and $43 from October and September, while a drop below $35 could see the stock fall to around $32 – where the 50% retracement line sits – or even $28.50 before finding new support if bearish momentum accelerates.
Near-term Keys: BWA upward trend into September was impressive, but the current downward trend should give bullish investors pause right now, and the fact that the stock’s fair value is dropping is another red flag that the company’s strong balance sheet doesn’t completely offset. I would look for another quarter of improvement, along with an improvement in my favorite fair value metrics like Book Value before taking BWA seriously from a long-term perspective. That means that if you want to work with this stock, the best probabilities lie in short-term trades. Use a break above $38 to think about buying the stock or using call options, with a peak anywhere between $42 and $43 acting as a good profit target. A drop below $35 could be a good signal to consider shorting the stock or working with put options, using $32 as a good initial profit target on a bearish trade.