Over the last few months, one of the best sectors of the stock market has been the Materials sector. From its bear market low in March to now, the sector has increased in value by nearly 81% as measured by the S&P 500 Materials Sector SPDR (XLB). This is a sector that I like to pay attention to as a barometer for the underlying relative health of the economy, because the companies that comprise it produce or mine the building blocks used to create most of the finished goods we use every day. The sector includes industries that cover chemicals and plastics, construction materials, paper, forest, and packaging products, as well as metals and minerals – which means that in some form, this sector touches practically every other segment of the economy in one more or another.
The last couple of days have given the market to push aggressively higher, as indications that Congress will remain divided seem to have given investors reason for hope. That offsets fears that seemed to exist prior to the election that a “blue wave” would lead to sweeping regulatory reforms, especially on the Tech sector that would blunt growth. Government intervention – with the exception of stimulus packages, that is – is generally not welcomed by the market, so a divided Congress increases the chances that no action will be taken. That means the markets can operate on a “business as usual” basis, which under the circumstances is being taken as a very good thing.
Another side benefit the market appears to be looking to post-election is the expectation that once the dust settles, government can start looking past the pre-election rhetoric and finger-pointing that prompted Republicans and Democrats to halt talks about a second set of stimulus spending. Even with what appears to be increasingly likely change in leadership in the Presidency, the government is going to need to look for ways to stimulate growth in productive ways. One of the most time-proven, cost-efficient methods is infrastructure investment, particularly mass transit. That kind of fiscal policy investment bleeds into a number of industries, which means that industries from Metals & Mining to Construction and Heavy Machinery could be a good position to benefit.
Steel Dynamics Inc. (STLD) is an interesting company in the Metals & Mining industry of this sector. This is a company with a solid balance sheet and fundamental numbers that have held up fairly well despite being pressured by broad economic conditions this year. The stock has also performed well since its bear market low in March, and in the last few weeks has retraced a bit off of a peak just a couple of dollars away from its pre-pandemic high. Is the stock is a good value, or has the rally pushed the stock’s price past reasonable valuation levels? Let’s find out.
Fundamental and Value Profile
Steel Dynamics, Inc. is a steel producing and a metal recycling company. The Company is engaged in the manufacture and sale of steel products, processing and sale of recycled ferrous and nonferrous metals, and fabrication and sale of steel joists and deck products. Its segments include steel operations, metals recycling operations, steel fabrication operations and Other Operations. It offers a range of steel products, such as sheet products, long products and steel finishing. The steel operations segment includes Butler Flat Roll Division, Columbus Flat Roll Division, The Techs galvanizing lines, Structural and Rail Division, Engineered Bar Products Division, Roanoke Bar Division, Steel of West Virginia and Iron Dynamics. The metals recycling operations segment consists of OmniSource Corporation. The fabrication operations produce steel building components. The Other Operations segment consists of subsidiary operations and smaller joint ventures. STLD has a current market cap of $6.8 billion.
Earnings and Sales Growth: Over the past year, earnings declined -26%, while sales dropped -7.76%. In the last quarter, earnings improved by 8.5%, while sales increased 11.29%. STLD operates with a modest margin profile that has been narrowing, which isn’t surprising; over the last twelve months, Net Income was 5.17% of Revenues, and narrowed to about 4.3% in the last quarter.
Free Cash Flow: STLD’s Free Cash Flow is adequate, at roughly $245 million, and which translates to a modest Free Cash Flow Yield of 3.79%. That marks a decline from around $811 million at the beginning of the year and $710.92 million in the quarter prior. The decline isn’t unexpected given broad economic conditions this year, but the concern is the way the decline has accelerated in the last quarter. This is a sign that profitability is also eroding, which makes this element that bears watching in the quarters ahead.
Debt to Equity: STLD has a debt/equity ratio of .65, which is reflects a conservative approach to leverage. The company’s balance sheet shows cash and liquid assets of about $1.56 billion in the last quarter versus long-term debt of $2.6 billion. There should be no problem servicing their debt, but the decline in Net Income as well as Free Cash Flow are narrowing the company’s flexibility that can only continue for so long.
Dividend: STLD pays an annual dividend of $1.00 per share, which at its current price translates to a very attractive dividend yield of about 3.25%. It is also worth noting that management has raised the dividend this year when many others are cutting or eliminating theirs; at the beginning of the year, the dividend was $.96 per share, per annum.
Price/Book Ratio: there are a lot of ways to measure how much a stock should be worth; but I like to work with a combination of Price/Book and Price/Cash Flow analysis. Together, these measurements provide a long-term, fair value target around $36 per share. That means that STLD is modestly undervalued, with about 12% upside from its current price.
Technical Profile
Here’s a look at the stock’s latest technical chart.
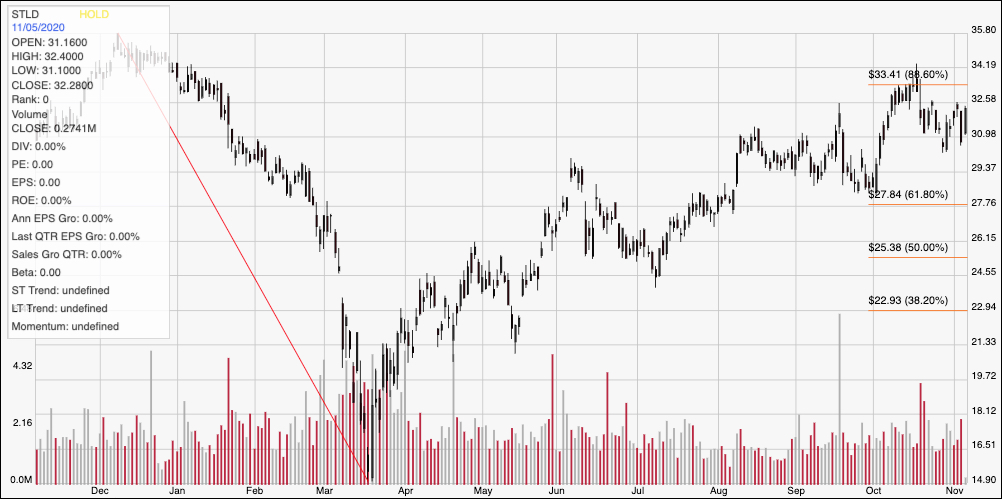
Current Price Action/Trends and Pivots: The diagonal red line marks the stock’s downward trend from October 2018 to March of this year. It also provides the baseline for the Fibonacci retracement lines on the right side of the chart. The stock rallied from its bear market low to start a new, intermediate term upward trend, rallying to the 88.6% retracement line at around $33.50 before falling back in the last couple of weeks. It is showing strong support at around $31 per share with resistance at that recent peak at $33.50. A break above $33.50 should give the stock room to push to about $36, at the stock’s December 2019, pre-pandemic high. A drop below $31 should see the stock drop to next support at around $28 where the 61.8% Fibonacci retracement line rests, with $25.50 the next likely level where the 50% retracement line sits if bearish momentum accelerates.
Near-term Keys: The stock’s drop off recent resistance could offer some useful short-term trading opportunities depending on which direction the stock moves in the near term. A push above $33.50 could be a good signal to consider buying the stock or working with call options, using $36 as a good, short-term bullish profit target. A drop below $31, on the other hand, could be a good opportunity to think about shorting the stock or buying put options, with $28 acting as a good initial profit target and $25.50 reachable beyond that point. What about value? The company has some useful fundamental strengths behind it, but declining Free Cash Flow and eroding Net Income are a concern that don’t make the stock’s modest value proposition more compelling. I would wait to see what another quarter of activity and fundamental data brings to re-evaluate the company’s fundamentals and value proposition before looking for a new, long-term investment in this stock.