This year’s pandemic has had a dramatic impact on the operations of just about every type of business in America. One of the business segments that has experienced an especially conspicuous decline is the Auto industry, where stay-at-home, self isolation orders at the beginning of the outbreak cratered demand for petroleum products of every type. Throughout the year, miles driven have been down across the country, as unemployment numbers have remained high and much of corporate America has shifted to remote, work-from-home operating models that have so far made the typical morning commute a thing of the past.
The lower driving trend extends to other aspects of society you might think about, but that translate to measurable effects on the industry. As infections in the country continue to increase, states are being forced to re-impose previously lifted restrictions that include moving school operations back to remote learning. That means less need for bus transportation as just one example of the broad impact the pandemic continues to have.
Despite the negative impact COVID has had on driving trends, a number of stocks in the Auto industry, and particularly in the Auto Components sub-industry, have performed relatively well this year. Cooper Tire and Rubber Co. (CTB) is one of only two publicly traded U.S. producers of rubber tires, along with Goodyear Tire and Rubber Co. (GT). As the smaller of the two, CTB operates in a more narrow niche, focusing on the replacement side of the business as opposed to selling tires for installation in new vehicles out of the factory. Despite clear impacts on operations this year from the conditions I just outlined, CTB’s balance sheet has remained very healthy; management has even managed to increase cash flow throughout the year and maintain their dividend payout. From a bear market low in March at around $14, investors have pushed the stock far past its pre-pandemic highs to near $42 per share.
Considering the headwinds I just mentioned, and that I think are likely to persist through the rest of the year and into 2021, I’m not sure the market is justified in pushing the stock 3x above its March lows; at the same time, however, many of the company’s other fundamental and valuation metrics argue just the opposite, and suggest that even with the impressive increase in price so far, the stock remains an intriguing opportunity from a value standpoint. Who should you believe? Let’s go over the numbers and let you decide for yourself.
Fundamental and Value Profile
Cooper Tire & Rubber Company is a manufacturer and marketer of replacement tires. The Company specializes in the design, manufacture, marketing and sales of passenger car, light truck, medium truck, motorcycle, and racing tires. The Company operates through four segments: North America, Latin America, Europe, and Asia. The North America segment comprises its operations in the United States and Canada. The Americas Tire Operations segment manufactures and markets passenger car and light truck tires, for sale in the United States replacement markets. The Latin America segment comprises its operations in Mexico, Central America, and South America. The European segment has operations in the United Kingdom and the Republic of Serbia. Its the United Kingdom entity manufactures and markets passenger car, light truck, motorcycle and racing tires and tire retread material. As of December 31, 2016, the Company operated nine manufacturing facilities and 20 distribution centers in 10 countries. CTB’s current market cap is $2.1 billion.
Earnings and Sales Growth: Over the last twelve months, earnings improved more than 317%, while revenues increased by 8.62%. In the last quarter, earnings were 2,116% higher (not a typo), while sales improved by 54%. Despite that impressive earnings pattern, the company’s margin profile is a sign of concern; over the last twelve months Net Income was 6.29% of Revenues, but fell to -0.81% in the last quarter.
Free Cash Flow: CTB’s free cash flow $407.52 million over the last twelve months. That marks a pattern of steady improvement throughout the year; Free Cash Flow was $236.17 million in the quarter prior and $74.98 at the beginning of the year. Its current level translates to an attractive Free Cash Flow Yield of 19.48%.
Debt to Equity: CTB has a debt/equity ratio of .24. This is a very conservative number. The company’s balance sheet demonstrates healthy liquidity and debt management as cash and liquid assets in the last quarter were about $495.6 million (up from around $137 million in late 2019) while long-term debt was about $319.4 million.
Dividend: CTB pays an annual dividend of $.42 per share, which translates to a dividend yield of about 1.01% at the stock’s current price.
Price/Book Ratio: there are a lot of ways to measure how much a stock should be worth; but I like to work with a combination of Price/Book and Price/Cash Flow analysis. Together, these measurements provide a long-term, fair value target around $49 per share. That means that even with the stock’s rally since March, it remains significantly undervalued, with 22% upside from its current price. It is also worth noting that in the last year, my fair value target increased from about $23 to its current level, which is another positive reflection of the company’s underlying, fundamental strength.
Technical Profile
Here’s a look at the stock’s latest technical chart.
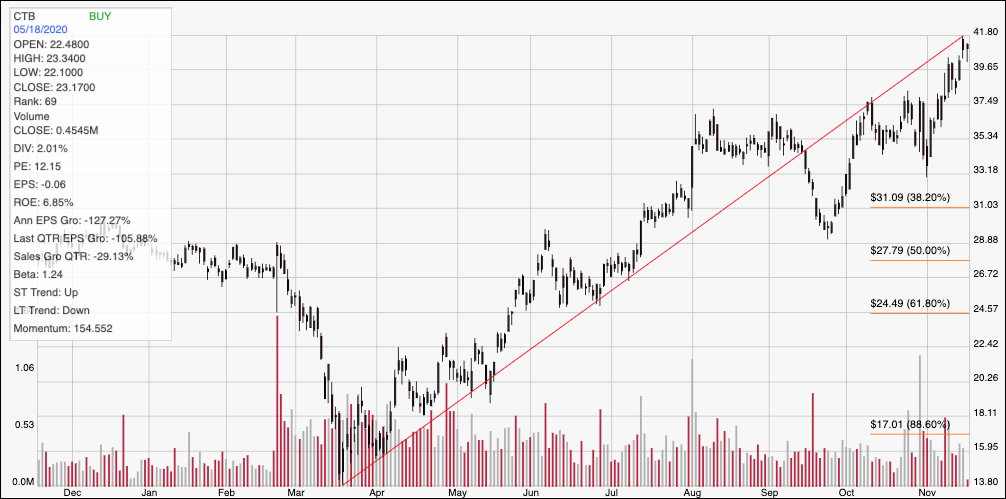
Current Price Action/Trends and Pivots: The chart above marks the last year of price activity. The red diagonal line also provides a baseline for the Fibonacci retracement line shown on the right hand side of the chart. The stock’s upward trend from its March, bear market low is clear, and in the last couple of weeks, that trend has accelerated as the stock broke resistance at around $37.50 to drive to a new, multiyear high at nearly $42 per share. The stock is a bit below that point now, and could drop back to about $37.50 before finding new support. Immediate resistance is at $42. A push above $42 could give the stock room to push to around $46.50, based on the distance between the last resistance break and the most recent peak. A drop below $37.50 should find next support at around $35, with $31 the next available support level if momentum reverses strongly to the bearish side.
Near-term Keys: The stock’s value metrics make the stock seem like a tempting opportunity right now. The truth is that the fundamental picture is better than I expected given broader market and industry conditions this year. CTB has shown impressive resilience based on its solid balance sheet and improving Free Cash Flow. The fall in Net Income is a red flag, and could translate to other areas of the balance sheet if it persists, and so does bear watching in the quarters ahead. If you prefer to look for a short-term trade, a push above $42 could give the stock room to rally to around $46.50, proving a good opportunity to buy the stock or work with call options. If you prefer to look for a bearish trade, look for a drop below $37.50 as a signal to consider shorting the stock or working with put options, with an eye on $35 as a bearish profit target point.