Being a contrarian investor can mean a few different things. To some, contrarian investing is correlated with value investing, and I think that makes sense in a lot of ways. For one thing, being a contrarian means recognizing that all price trends – up or down – are finite in length and duration. That means that eventually, upward trends reverse down, and downward trends inevitably reverse up. That understanding dovetails nicely with technical trend analysis, where traders try to identify stages where trend reversals become more likely, which can then provide useful signals to reverse the direction of their trading. Looking for those times, and those signals is something that I have found to be a useful supplement to my value analysis, and to generally increase the probability that the stocks I work with not only offer good price discounts, but also represent useful opportunities to profit from a reversal to a new upward trend.
Another reason value analysis and the contrarian mindset often complement each other is because while most investors shy away from stocks that are dropping, value investors and contrarians alike start to take them more seriously. That contrarian mindset also tends to shade an investor’s perspective when a stock is going up; the more extended an upward trend becomes, the more a contrarian begins to doubt the trend will be able to last. That is an attitude that often flies in the face of the herd mentality that often accompanies big upward moves in a stock’s price – especially if broader economic or societal conditions coincide with that rally.
The J.M. Smucker Company (SJM) is an interesting example of what I mean. If you’ve followed this space for very long, you’ve seen me write quite a bit about my opinion that stocks in the Consumer Staples sector, and Food Products even more specifically, are a good place to be putting your money. In 2019, that was a strongly contrarian claim to make, because the sector and that industry were pretty strongly out of favor with the movement of the rest of the market. SJM’s price movement at that time mirrored the industry, dropping from a high at around $128.50 to a low at the beginning of 2020 at around $103 per share. As COVID-19 fears increased, and social distancing and stay-at-home measures were put in place across North America to try to limit the virus’ spread, Food Products stocks like SJM started to see a big jump in volatility as the swings in price became more and more dramatic. After hitting a new low in mid-March at around $95, SJM started a big, new rally, hitting a peak around $124 in mid-April – a rebound of more than 30% in about a month. After that, the stock dropped back to a low at around $104 in early July before rallying again to about $123 by the end of August. From that point, however, the stock has settled into a narrowing consolidation range between $120 and $112 as the volatility seen during the initial phase of the pandemic has faded to normalized levels.
The stock’s price performance is interesting when considered against the backdrop of signs that the company’s fundamentals are improving; Free Cash Flow has improved, and so has liquidity in the form of cash and liquid assets throughout the course of the year. The tendency of American consumers to stockpile as much as possible in the early stages of the pandemic, along with indications that demand for prepackaged foods priced at good value remained high were a couple of the main reasons that sales for the company have remained healthy during the pandemic. Additional industry and consumer trends and forecasts also suggest that even as vaccines become more widely available and the world gradually begins some kind of a “return to normal,” that a certain level of “stickiness” will keep consumer demand for Food Products high, and I think that makes sense as economic uncertainty is not likely to completely go away in 2021. That could mean that the stock’s current consolidation pattern could be an early indication of a longer-term shift in trend back to the upside; in the meantime, the value proposition is attractive enough to make SJM a stock to consider using as part of a useful, value-oriented portfolio.
Fundamental and Value Profile
The J. M. Smucker Company is a manufacturer and marketer of branded food and beverage products and pet food and pet snacks in North America. The Company’s segments include U.S. Retail Coffee, U.S. Retail Consumer Foods, U.S. Retail Pet Foods, and International and Foodservice. The Company’s U.S. retail market segments consist of the sale of branded food products to consumers through retail outlets in North America. In the U.S. retail market segments, the Company’s products are sold to food retailers, food wholesalers, drug stores, club stores, mass merchandisers, discount and dollar stores, military commissaries, natural foods stores and distributors, and pet specialty stores. In International and Foodservice, the Company’s products are distributed domestically and in foreign countries through retail channels and foodservice distributors and operators, such as restaurants, lodging, schools and universities, healthcare operators.SJM’s current market cap is $13 billion.
Earnings and Sales Growth: Over the last twelve months, earnings improved 5.75%, with sales also increasing almost 4%. In the last quarter, earnings rose 0.84%, while sales grew by a little over 3%. SJM’s margin profile is healthy and stable; over the last twelve months, Net Income was 10.92% of Revenues, and increased in the last quarter to about 11.35%.
Free Cash Flow: SJM’s free cash flow is healthy, at around $1.3 billion for the trailing twelve month period; that translates to a Free Cash Flow yield of about 10.22%. SJM’s free cash flow has improved consistently from the beginning of the year, when the number was $988 million, and about $723 million in the last quarter of 2019.
Debt to Equity: SJM has a debt/equity ratio of .46, a relatively low number that indicates the company operates with a conservative philosophy about leverage. A big portion of their long-term debt, which was about $3.9 billion in the last quarter comes from the acquisition of pet food company Ainsworth in May of 2018 for $1.7 billion. It is worth noting that at the mid-point of this year, long-term debt was significantly higher, at $5.5 billion. Cash and liquid assets are limited, at only $405.6 million, but this is a major improvement from the latter part of 2019 when cash was only around $48 million, and $74.4 million at the end of the first quarter of 2020. While their balance sheet for now indicates their operating margin is more than adequate to service their debt, and liquidity is growing, it still bears watching. The increase is a good sign, but cash needs to keep increasing, with long-term debt continuing to decrease, to confirm the increasing strength in SJM’s balance sheet.
Dividend: SJM pays an annual dividend of $3.60 per share, which translates to a yield of 3.14% at the stock’s current price. It is also noteworthy that SJM’s dividend has increased from $3.52 per share, per annum earlier in the year.
Price/Book Ratio: there are a lot of ways to measure how much a stock should be worth; but I like to work with a combination of Price/Book and Price/Cash Flow analysis. Together, these measurements provide a long-term, fair value target around $134 per share. That means the stock is undervalued with about 17% upside from its current price. The company’s increasing fundamental strength is reflected in its valuation metrics as well, since this same analysis provided a fair value target price at around $124 as recently as July of this year.
Technical Profile
Here’s a look at the stock’s latest technical chart.
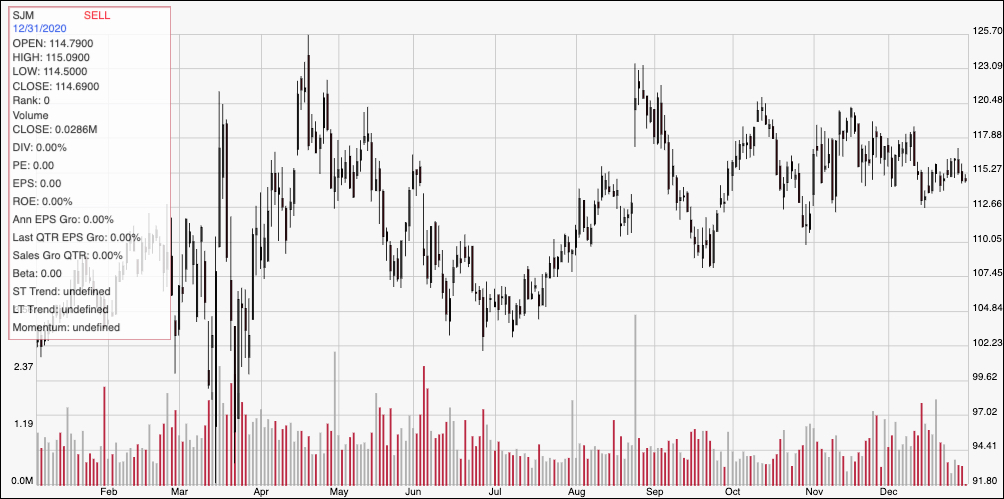
Current Price Action/Trends and Pivots: The chart above displays the stock’s price activity over the last year. From the August peak at around $123, the stock has formed an increasingly narrow consolidation range, as support pivots have increased while resistance pivots have occurred on a steadily lower basis. Together, that forms a pennant, a technical pattern that short-term traders often like to use to look for stocks that are likely to break into useful new trends. Current resistance is around $116, with immediate support at around $112.50. A break above $116 should have short-term upside to about $120, while a break above that point would mark the signal point for a new upward trend. A drop below $112.50 should see additional downside to between $110 and $108 based on previous pivot low activity in September and October; a drop below $108 would signal a new downward trend, with next support expected to be around $103.
Near-term Keys: SJM’s fundamentals are solid, and have improved throughout the year, even as liquidity remains a concern and continues to bear watching. The value proposition at the stock’s current price is much better than it was earlier in the year, and I think offers a good reason to watch the stock more closely. If bullish momentum continues and pushes the stock above $116, you could use that as a signal to buy the stock or work with call options, using $120 as a good initial profit target for a bullish trade. If momentum forces the stock to drop below $112.50, you could use that as a signal to consider shorting the stock or working with put options, with $110 to $108 acting as the early exit target on a bearish trade.