It isn’t too hard to argue that one of the most severely impacted industries over the last year as a result of coronavirus has been the auto industry. That shouldn’t come as much of a surprise, considering that for most of last spring, shutdown mandates and shelter-in-place orders brought global economic activity to a standstill. Through the summer, there were some indications that segments of the economy may be recovering as restrictions began to ease, including a report in June that saw new auto sales actually increase; but a new wave of infections across the U.S. and in Europe moving into the colder months of the year raised doubts about whether that kind of increase in industry activity can be sustained.
The ironic thing about the Auto industry is that, as measured by the NASDAQ Global Auto Index ETF (CARZ), stock market activity would seem to suggest that the industry is in great shape. After hitting a bear market low a little below $20 a year ago, the stock more than doubled in value, hitting a new 52-week high at nearly $60 just last week. The ETF is tied primarily to the stocks of automakers themselves, which the market has generally been treating pretty well since March; it is also being boosted by the massive run-up in price of Tesla Inc. (TSLA), which is up more than 40% from its own March low point around $70. Rather than any useful recovery in the automotive Industry, I think the rally is benefitting, at least in part by shifting media focus on clean energy and the attractiveness of electronic vehicles, especially from the Millennial demographic.
On a macroeconomic level, the industry has been challenged, not only by reduced demand driven by the health crisis, but also by oil prices, which held in the mid-$30 to $45 per barrel price range for most of 2020. Some analysts saw the commodity’s plunge into the teens in the early part of the pandemic as an indication that auto components makers like Goodyear Tire & Rubber (GT) might be able to moderate demand declines with cost savings from depressed petroleum prices. Extreme cold weather conditions, and continued cuts in production to curb supply have pushed oil prices into the $50 to $60 per barrel range over the last few weeks, though, which tends to diminish the validity of that estimate.
The Auto Components industry is a segment of the industry that I like to pay attention to, because I think it provides a barometer for the prospects of the auto industry on a broad basis beyond merely auto sales, which are usually skewed towards new vehicles. The companies in this industry provide OEM (Original Equipment Manufacturer) goods and services, which applies to new sales, as well as for replacements, and most of the smart companies in the industry try to maintain a healthy balance between their OEM and replacement businesses. GT is a company in the industry that I’ve followed for a while, and that makes up just two publicly trade tire manufacturers in the United States. It can be said GT is an American icon, too, because Goodyear is a global tire brand that is immediately recognized. The company has struggled for the past few years as new auto sales have generally declined, and the truth is that COVID-19 has only made things more difficult; however their last couple of earnings reports have provided some interesting indications that the company’s fundamental profile is improving in useful ways. When you add to that the fact that despite a sizable increase since the begining of February the stock is still trading at a major discount to its useful valuation metrics, this might be a stock that is worth considering as a long-term, value-based opportunity. Let’s dive in.
Fundamental and Value Profile
The Goodyear Tire & Rubber Company is a manufacturer of tires. The Company operates through three segments. The Americas segment develops, manufactures, distributes and sells tires and related products and services in North, Central and South America, and sells tires to various export markets. The Americas segment manufactures and sells tires for automobiles, trucks, buses, earthmoving, mining and industrial equipment, aircraft and for various other applications. The Europe, the Middle East and Africa (EMEA) segment develops, manufactures, distributes and sells tires for automobiles, trucks, buses, aircraft, motorcycles, and earthmoving, mining and industrial equipment throughout EMEA under the Goodyear, Dunlop, Debica, Sava and Fulda brands. The Asia Pacific segment develops, manufactures, distributes and sells tires for automobiles, trucks, aircraft, farm, and earthmoving, mining and industrial equipment throughout the Asia Pacific region, and sells tires to various export markets. GT’s current market cap is $3.3 billion.
Earnings and Sales Growth: Over the last twelve months, earnings increased 131.5%, while sales dropped about -1.5%. In the last quarter, earnings rose 340% while sales improved by 5.5%. GT is a company that historically operates with a narrow margin profile, but that saw that profile drop into negative territory in late 2019 and deteriorate even more through most of 2020. Despite health crisis-driven pressures, the margin profile has shown small, but steady and incremental improvements that seem to indicate the company is turning the corner. In the last quarter, Net Income as a percentage of Revenues was 1.72% versus -10.18% in the last twelve months. Both of these metrics also represent improvements from the quarter prior.
Free Cash Flow: GT’s free cash flow measurement is a significant source of strength in the company’s fundamental profile. Over the last twelve months, Free Cash Flow was $468 million, marking an increase from $421 million in the previous quarter, and well above its level at the beginning of 2020, when Free Cash Flow was $262 million. That strength is a good sign that the improvement in Net Income is more than just a temporary phenomenon.
Debt to Equity: GT has a debt/equity ratio of 1.67. That is a bit high, but this is actually a pretty typical pattern for most companies in the Auto Components industry, and isn’t alarming by itself. That said, GT’s liquidity, which was very healthy just a few years ago (more than $2 billion at the beginning of 2015) has been consistently declining since that point. As of the last quarter, the company had a little over $1.5 billion in cash and liquid assets against about $5.7 billion in long-term. I do think it is useful to recognize that cash has increased from about $971 a year ago. Their balance sheet indicates that they should be able to maintain their debt service without too much difficulty, with cash reserves that remain generally healthy, but have admittedly been under pressure from the company’s negative operating margins. If that pattern continues, liquidity will become a major concern; however if Net Income continues to improve in the quarters ahead, the balance sheet should strengthen even more.
Dividend: GT suspended their dividend in the early part of 2020, with no indication of when it would be resumed.
Price/Book Ratio: there are a lot of ways to measure how much a stock should be worth; but I like to work with a combination of Price/Book and Price/Cash Flow analysis. Together, these measurements provide a long-term, fair value target around $19.65 per share. That means the stock is very undervalued, with about 38% upside from its current price.
Technical Profile
Here’s a look at the stock’s latest technical chart.
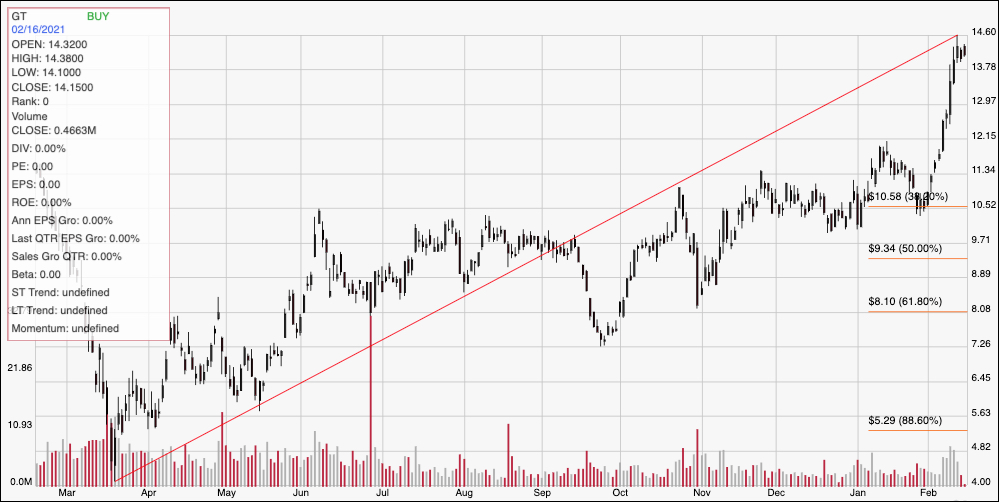
Current Price Action/Trends and Pivots: The diagonal red line traces the stock’s upward trend from a March 2020 low at around $4 to its peak, which just happened a few days ago at around $14.50. It also provides the baseline for the Fibonacci retracement lines on the right side of the chart. After gradually rising from that $4 low to a peak at around $11 toward the end of 2020, the stock pushed up to about $12 in January before really picking up momentum in the last two weeks; the stock used support at around $10.50 from the 38.2% retracement line to push about 40% higher in just the last two weeks. Some of that increase appears likely to be tied to the company’s improving fundamentals, but is likely also tied to the expectation that the rest of the year will see further recovery towards back-to-normal conditions. Resistance is right at $14.50, with possible upside to about $17 (based on the distance between the last resistance break and the recent peak) if the stock can push above that level. Immediate support is at around $12.
Near-term Keys: GT’s value proposition certainly is very attractive, and given the company’s increasing fundamental strength this new rally could be the start of a much longer, even more sustained long-term bullish trend. If you prefer to focus on short-term strategies, you could use a push above $14.50 as a signal to buy the stock or work with call options, with $17 acting as a useful profit target. A pivot off of resistance at $14.50 to the downside could be a signal to consider shorting the stock or working with put options, with the stock’s next support at around $12 providing a reasonable profit target on a bearish trade.