I’ve been writing quite a bit lately about positioning yourself conservatively to keep trading in a functional way even when the market is very extended. The commentary lately, and even market activity (increasing bond yields, rising inflation uncertainty), seems to be grappling with this question too.
One of the biggest elements that comes to play for my investing system is relying on stocks that I think are trading at a useful discount. That generally keeps me away from the high fliers that analysts like to buzz about, but it’s also a pretty useful way to find stocks that I think represent less short-term price risk than stocks at the stop of extremely extended upward trends. That’s one of the reasons a lot of focus for most of the past year has included the Consumer Staples sectors, and Food Products stocks in general. The sector generated a lot of buzz last year because of the pandemic-imposed shift to eating at home, but as the market is anxious to look forward to the much-anticipated “return to normal,” investors seem to be less bullish about these stocks despite a lot of fundamental strength in the industry and valuations that I continue to find very attractive. Plus, I agree with some estimates that are predicting eating at home to be a “sticky” trend because of the savings that families have generally been able to see as a result. Remember that unemployment is still very high, and Fed chair Jerome Powell’s comments today indicate that while the Fed sees positive signs of economic growth ahead, we aren’t there yet. We’re all tired of COVID, but even with vaccinations increasing, there is long way to go to put the pandemic in the rear view mirror. I think that among other things, means that families are going to have to stay budget-conscious, especially about keeping their pantries, fridges and freezers stocked. That is the stickiness that I think is likely to extend through 2021.
Kellogg Company (K) is a good example of what I mean. They do a lot more than just cereal, of course, but the truth is that the cereal aisle is where you recognize them the most quickly. After following the broad market to a bearish low in March 2020 around $54, the stock rebounded to a peak in late July at nearly $73. From that point, the stock has dropped back into a clear downward trend that may have found a bottom last week. The most recent earnings report shows that K’s balance sheet remains healthy, with improving profit and operating margins and a healthy dividend providing good evidence of sustained fundamental strength. That’s why I think that, K’s value proposition is still a great reason to keep working with this stock. Let’s dive in to the numbers.
Fundamental and Value Profile
Kellogg Company is a manufacturer and marketer of ready-to-eat cereal and convenience foods. The Company’s principal products are ready-to-eat cereals and convenience foods, such as cookies, crackers, savory snacks, toaster pastries, cereal bars, fruit-flavored snacks, frozen waffles and veggie foods. Its segments include U.S. Morning Foods, which includes cereal, toaster pastries, health and wellness bars, and beverages; U.S. Snacks, which includes cookies, crackers, cereal bars, savory snacks and fruit-flavored snacks; U.S. Specialty, which represents food away from home channels, including food service, convenience, vending, Girl Scouts and food manufacturing; North America Other, which includes the U.S. Frozen, Kashi and Canada operating segments; Europe, which consists of European countries; Latin America, which consists of Central and South America and includes Mexico, and Asia Pacific, which consists of Sub-Saharan Africa, Australia and other Asian and Pacific markets. K’s current market cap is $20.4 billion.
Earnings and Sales Growth: Over the last twelve months, earnings declined about -5.5%, while revenues were 7.5% higher. In the last quarter, earnings we -5.5% lower, while sales increased 1.02%. The company operates with a healthy margin profile that did weaken in the last quarter, which is consistent with the pattern of decreasing liquidity as well. Over the last twelve months, Net Income during was 9.08% of Revenues, and declined in the last quarter, to 5.92%.
Free Cash Flow: K’s free cash flow is $1.48 billion and translates to a Free Cash Flow Yield of 7.27%. It should also be noted that Free Cash Flow has improved steadily in each quarter of the past year, from about $947 at the beginning of 2020 to $1.36 billion mid-year. This improvement is a strong counter to the negative patterns I just described and is the primary reason I think the declines are temporary.
Debt to Equity: K has a debt/equity ratio of 1.86. This is a high number, and makes them one of the most heavily leveraged stocks in the Food Products industry. Their balance sheet indicates that in the last quarter, cash and liquid assets were a little over $435 million, versus $6.7 billion in long-term debt. That marks a decline from the last quarter, when cash was $1.5 billion against $7 billion in long-term debt. The decline is a concern to be watched, but something that I expect to be a temporary occurrence.
Price/Book Ratio: there are a lot of ways to measure how much a stock should be worth; but I like to work with a combination of Price/Book and Price/Cash Flow analysis. Together, these measurements provide a long-term, fair value target around $91 per share, which means that K remains extremely undervalued, with about 53% upside from its current price. I should also mention that in mid-2020, this same analysis offered a $79 long-term target price, and $89 just a few weeks ago before the latest earnings report.
Technical Profile
Here’s a look at the stock’s latest technical chart.
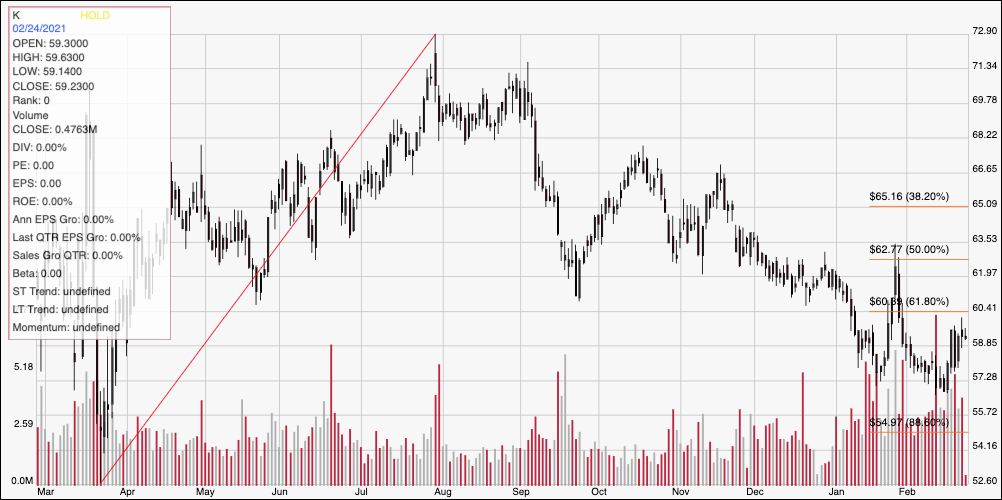
Current Price Action/Trends and Pivots: This chart traces the stock’s movement over the last year. The diagonal red line traces the stock’s upward trend from its March 2020, bear market low at around $54 to its July high at around $73. It also provides the baseline for the Fibonacci retracement lines shown on the right side of the chart. After dropping to about $60 in September, the stock temporarily rallied before peaking again at $66 and resuming its downward trend. That includes an acceleration of bearish momentum in the latter part of 2020, finding support in mid-January at around $57, where it saw a quick, hard rally (like a lot of Food companies) to a quick peak at around $62 before dropping back again. K found strong support around $57 and has rallied a bit off of that level, with immediate resistance at around $61 based on pivot lows in December and September of last year and also consistent with the 38.2% retracement line.
Near-term Keys: Even with K’s current downward trend, the value proposition on this stock is compelling. If you’re willing to accept the possibility of some near-term volatility, K is a stock that offers an excellent long-term opportunity. If you prefer to focus on short-term trading strategies, you could the current bounce off of support as a signal to consider buying the stock or working with call options; but the smart approach in this case would be to work with very short-term price targets, with resistance at around $60 to $61 offering a good exit point. A drop below $57, on the other hand would provide a strong signal to consider shorting the stock or buying put options, using the stock’s 52-week low at around $54 as a useful profit target on a bearish trade.