Early in my investing career, I put a lot of focus on understanding technical concepts like identifying short-term reversal points as support and resistance, trend formations over time, and how all of that information can be applied against a stock’s current price to recognize signals about a stock’s likely direction across multiple time periods in the future. One of the core principles about technical analysis that was also drilled into my head is that “the market is always right.” That idea is designed to disconnect a person’s bias about a company – whether or not you like the company or what their core business is – from the investing decision and instead learn to rely on the stock’s price action to drive a more objective approach to trade timing as well as what kind of trade to make – buy, sell, or stay away.
The mindset I just outlined tends to dismiss the value argument, which relies on the company’s underlying fundamental strength to drive an evaluation about what the stock should be worth. Pure technicians operate on the basis that the market prices in all available information about a company into its stock at all times, no whether that information is qualitative, quantitative or otherwise, which means that whatever a stock’s price is today, that is where it probably should be. It’s why swing and momentum traders don’t care so much about what a stock’s price is right now as much as which way it’s going right now, and what that direction might say about where it is likely to go next.
In the years since I cut my teeth on those technical concepts, as I’ve studied and learned more about fundamental and value-based principles, I’ve learned to combine the best of both the technical and fundamental viewpoints into the system I use now. Understanding where a stock is right now in relation to its trends helps to shape my viewpoint about the probabilities of also identifying stocks at useful valuation levels. Sometimes, those principles work well in concert with each other and at other times they seem diametrically opposed. The longer a bull market lasts, for example, the harder it gets to find stocks with the ideal combination of a value and fundamental-driven discount with a trend that leads me to also believe potential downside could be limited.
The Financial sector is a good example of what I mean. Since the beginning of the pandemic, the sector has been one of the biggest stars of the market, nearly doubling in value from a bear market bottom in mid-March of 2020 as measured by the U.S. Financials iShares ETF (IYF). That means most of the stocks in the sector have also been rallying over the same period, which for most trend followers means these stocks should keep going up. However, I’ve learned to rely on a basic principle of trend analysis, which suggests the risk of a significant trend reversal – positive or negative – increases the longer a trend lasts. This is an idea that matches my attitude about value investing, and tends to push my search for value to stocks that the rest of the market has already dismissed because they’ve been going down.
In the Financial sector one of the stocks that I like to pay attention to is U.S. Bancorp (USB). While this company will usually not get mentioned on news media when talking heads start talking about the largest banking institutions in the U.S., it is the 5th largest bank in the U.S. by deposits. A better-than-expected housing market in 2020 and continuing into this year are among elements of this company’s business that have provided tailwinds to its diversified revenue stream. They boast a very healthy balance sheet with liquid reserves well in access of debt obligations and a healthy dividend that makes tempting fodder for income-seeking investors. The stock itself has followed the sector higher, especially since the last quarter of 2020, having increased nearly 50%, but still about -16% its pre-pandemic highs around $62. Does that mean that this is a stock that even with its impressive rally over the last six months, it could also offer an attractive value opportunity? Let’s find out.
Fundamental and Value Profile
U.S. Bancorp is a financial services holding company. The Company provides a range of financial services, including lending and depository services, cash management, capital markets, and trust and investment management services. It also engages in credit card services, merchant and automated teller machine (ATM) processing, mortgage banking, insurance, brokerage and leasing. Its banking subsidiary, U.S. Bank National Association, is engaged in the general banking business and offers commercial and consumer lending, lending services, depository services and ancillary services. Its non-banking subsidiaries offer investment and insurance products to the Company’s customers principally within its domestic markets, and fund administration services to a range of mutual and other funds. The Company’s bank and trust subsidiaries provide a range of asset management and fiduciary services for individuals, estates, foundations, business corporations and charitable organizations. USB’s market cap is about $81 billion.
Earnings and Sales Growth: Over the last twelve months, earnings declined -12%, while sales dropped about -10%. In the last quarter, earnings declined by -4% while sales were also -4% lower. Despite the declining earnings pattern over the past year, USB’s margin profile is very healthy and strengthening; Net Income as a percentage of Revenues was 19.65% over the last twelve months, and strengthened in the last quarter to a little over 25%.
Free Cash Flow: USB’s free cash flow was about $2 billion over the past twelve months and translates to a Free Cash Flow Yield of 2.54%. It is noteworthy that this number is significantly below the level it was reported at the end of 2019, which was $4.8 billion. It has increase over the past two quarters, from $1.4 billion in September of 2020.
Dividend Yield: USB’s dividend is $1.68 per share, and translates to an above-average yield of 3.11% at its current price.
Debt to Equity: USB has a debt/equity ratio of .87. This is a manageable number. Their balance sheet shows $62.6 billion in cash and liquid assets against about $41.2 billion in long-term debt. Debt is significantly above the $31 billion mark it saw in mid-2020, while cash has increased from about $52.3 billion in mid-2020.
Price/Book Ratio: there are a lot of ways to measure how much a stock should be worth; but I like to work with a combination of Price/Book and Price/Cash Flow analysis. Together, these measurements provide a long-term, fair value target just little under $27 per share. That means the stock is significantly overvalued, with about -49% downside from the stock’s current price. It also puts the stock’s bargain price at around $21.50 per share.
Technical Profile
Here’s a look at the stock’s latest technical chart.
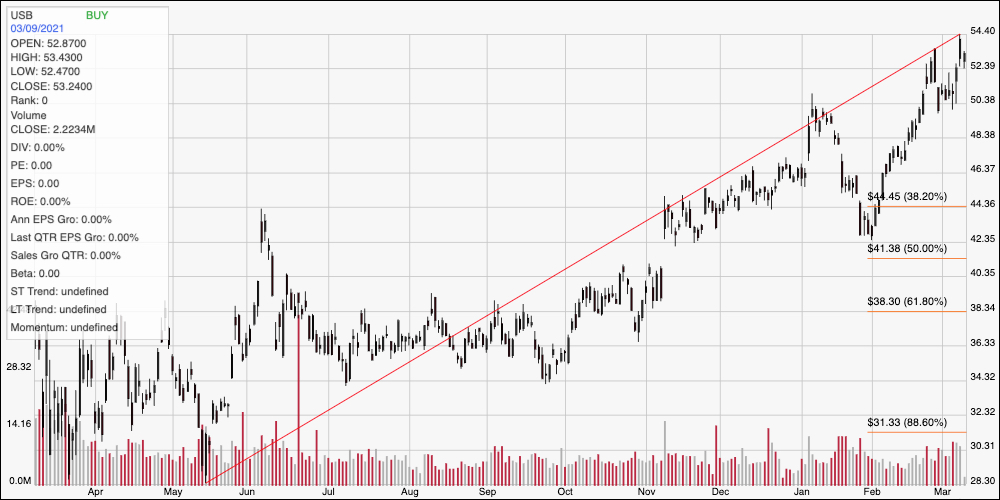
Current Price Action/Trends and Pivots: This chart traces the stock’s movement over the last year. The diagonal red line traces the stock’s upward trend from its March 2020 low at around $28 to peak just the other day at around $54. It also provides the baseline for the Fibonacci retracement lines shown on the right side of the chart. The stock has dropped off of its last peak somewhat, marking immediate resistance at $54, with current support sitting back at around $54 where the last resistance break came in late February. The $4 distance between that that last resistance break and the most recent pivot high also provides a target distance to work with if the stock pushes above $54, putting the next likely peak at around $58. If bearish momentum accelerates and pushes the stock below support at $50, its next most likely support level is around the highs seen in December 2020 at around $46.
Near-term Keys: Given the stock’s momentum, the best probabilities of success right now lie clearly on the bullish side USB – but the smart bet is to wait to see if the stock can push above its recent peak at $54. That would provide a good signal to buy the stock or work with call options, using $58 as a good, quick-hit profit target. A drop below $50 could be used to think about shorting the stock or buying put options with an eye on next support at $46 as a useful profit target. Despite USB’s overall fundamental strength and generally solid balance sheet, its stock price is clearly overvalued, which means that if you want to think about USB as a long-term investment opportunity, it really fits into a growth stock description more than a value-based one.