A reopening economy in the United States, Europe, and other parts of the world is generally giving analysts reasons to start pointing to stocks they believe are well-positioned for recoveries in consumer activities that have been hampered by pandemic-driven restrictions. One of the sectors that has been seeing a boost, particularly in the last couple of weeks is the Energy sector, where the increasing prospect for consumers take vacations, weekend getaways, and resume other “normal” activities – along with expected increases in supply to meet rising demand – should help to keep rising oil prices around current levels.
The rally from their lows – WTI crude bottomed at less than $10 per barrel, while Brent’s bottom was a little below $20 – has been particular impressive since November of last year, and has helped provide enough of a tailwind for the more conservatively managed companies in the sector to start stabilizing their balance sheets and begin to recover from of what many analysts thought might be an unsalvageable situation. It’s true that many of the largest, most recognizable names in the industry absorbed big blows in the form of Net Income turns to negative territory and declining profitability as reflected by measurements like earnings and free cash flow.
Schlumberger N.V. (SLB) is one of the largest companies in the world in the Energy Equipment & Services industry. Its stock price throughout the past year has pretty much mirrored that of the rest of the energy sector, dropping from around $42.50 before the pandemic to a March 2020 low around $12. It rallied to a peak in June at around $22.50 per share, and then fell back near to its bear market low in October. From that point, the stock has followed the broad market, and a lot of other stocks in the sector into a strong upward trend, with a peak in March above $30 per share. After dropping back from that high to an April low around $25, the stock has picked up momentum again, driving near to that March high as of this writing. There are aspects of SLB’s fundamental profile that are better than you might expect them to be, including a turn in the last quarter to profitability that might be a sign it is rounding the corner from drastic, pandemic-induced drawdowns. Is that good enough to make a case to add SLB to a growing list of stocks in the Energy sector that are presenting tempting value prospects? Let’s take a look.
Fundamental and Value Profile
Schlumberger N.V. provides technology for reservoir characterization, drilling, production and processing to the oil and gas industry. The Company’s segments include Reservoir Characterization Group, Drilling Group, Production Group and Cameron Group. The Reservoir Characterization Group consists of the principal technologies involved in finding and defining hydrocarbon resources. The Drilling Group consists of the principal technologies involved in the drilling and positioning of oil and gas wells. The Production Group consists of the principal technologies involved in the lifetime production of oil and gas reservoirs and includes Well Services, Completions, Artificial Lift, Integrated Production Services (IPS) and Schlumberger Production Management (SPM). The Cameron Group consists of the principal technologies involved in pressure and flow control for drilling and intervention rigs, oil and gas wells and production facilities. SLB has a current market cap of $41.3 billion.
Earnings and Sales Growth: Over the last twelve months, earnings decreased -16%, while sales declined nearly -30%. In the last quarter, earnings were -4.55% lower while sales slid by -5.6%. SLB’s operating profile is negative for the past year, with improvement in the last quarter; Net Income versus Revenue over the last year was -13.3% (an improvement from -44.57% on a trailing twelve-month basis in the quarter prior), but managed to strengthen in the last quarter to 5.72%. The turn to positive Net Income on a quarterly basis, with progress in the twelve-month figure could be an early sign the company has navigated its way through the worst effects of the pandemic, but a useful pattern of improving Net Income on an annual basis could take several quarters to be seen.
Free Cash Flow: SLB’s Free Cash Flow is generally healthy, but also reflects the challenges of the past year, at a little more than $1.4 billion. That represents steady a decline from $2.9 billion about six months ago and a little over $4 billion at the mid-point of 2020. The current number translates to a Free Cash Flow Yield of 3.54%.
Debt to Equity: SLB has a debt/equity ratio of 1.22, which indicates the company is highly leveraged. That isn’t particularly surprising given that a number of companies in the Energy sector have borrowed heavily during 2020. Cash and liquid assets in the last quarter were $2.9 billion versus $15.8 billion in long-term debt. This is a pretty clear indication of the pandemic’s effect on SLB’s bottom line, which is putting pressure on the company’s liquidity. It is also a reason that I think paying attention to Net Income on both a quarterly and annual basis are going to be important in the next few quarters.
Dividend: SLB pays an annual dividend of $.50 per share (reduced from about $2.00 per share in 2019, which is no surprise given the erosion of the company’s profitability), which at its current price translates to a dividend yield of about 1.76%.
Price/Book Ratio: there are a lot of ways to measure how much a stock should be worth; but I like to worth with a combination of Price/Book and Price/Cash Flow analysis. Together, these measurements provide a long-term target at almost $20 per share. That means the stock is overvalued, with about -33% downside from the stock’s current price, and a useful discount a little below $16.
Technical Profile
Here’s a look at the stock’s latest technical chart.
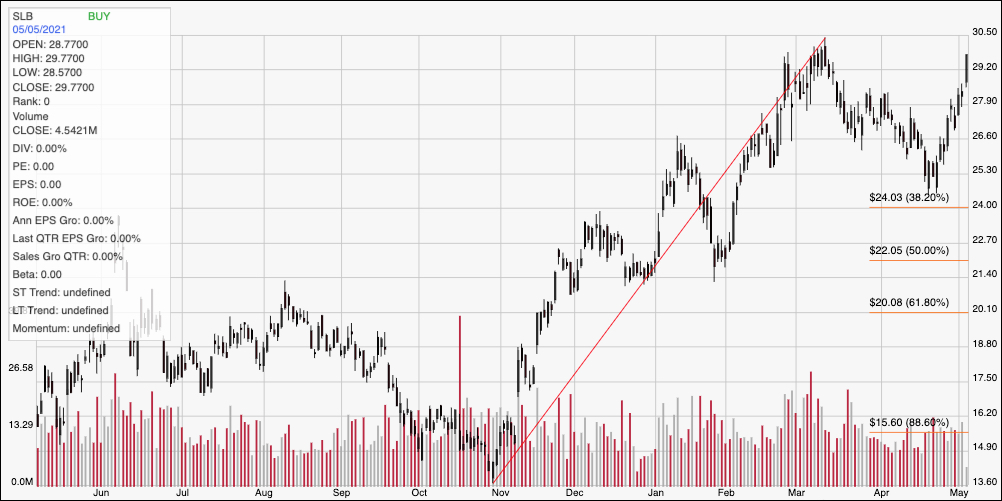
Current Price Action/Trends and Pivots: The chart above displays the last year of price activity, with the diagonal red line tracing the stock’s rally from about $13.50 in November to a peak at around $30.50 in March. It also provides the baseline for the Fibonacci retracement lines shown on the right side of the chart. The stock dropped back off of that high point into late April, finding support at around $25 and driving near to that March peak as of now. Immediate resistance is at $30.50, while current support should be at around $28 based on previous pivot activity around that level in the last week of March. A push above $30.50 should have room to push to about $32.50 to $33, based on the distance between current support and resistance, while a drop below $28.50 should have downside room to a level between $25 and $24 where the 38.2% retracement line.
Near-term Keys: There really isn’t any way to suggest that SLB’s value proposition right now is useful; under current circumstances, only an extremely aggressive and speculative investor would be willing to buy the stock with any kind of long-term forecast right now given the current difficulties in the company’s operating profile and the stock’s clearly overvalued status. That means that the best probabilities lie with short-term trading strategies; if the stock drops below $28, consider shorting the stock or buying put options, using $25 as a quick-hit profit target. A rally and break above $30.50 could offer an interesting signal to buy the stock or work with call options, with $33 providing a useful profit target on a bullish trade.