The Tech sector has easily been one of the most closely watched segments of the economy throughout the past year and a half. Technology companies provided the tools that allowed much of corporate America to keep things going during the pandemic by shifting their workforces to remote working models, and investors bought those stocks enthusiastically, which is a big reason that the sector not only moved past its pre-pandemic highs, but surged more than 40% from that high-water mark to establish a new all-time high in April of this year, as measured by the S&P 500 Technology SPDR ETF (XLK). Despite that big upward move, there were some stocks that definitely did not keep pace. That is always true in any sector, not matter what the broad sector momentum looks like, there are always individual companies that will diverge from the normal pattern.
In the same vein, companies that focus on the “enterprise” space – where most corporate tech spending has traditionally gone, for products like servers, computers, printers, and the tools to connect them all in a traditional network setting, for example – have struggled to keep up. Some analysts have speculated how much of the work-from-home element of corporate operations will become a permanent part of business life. Even so, there are also strong signs that for many businesses, back-in-office is becoming an increasing expectation. That could mean that while many of the companies that operate in the Enterprise space could continue to be pressured throughout 2021, revenues and earnings in many cases have also likely begun their own recovery.
That brings us to today’s highlight. Hewlett Packard Enterprise Co. (HPE) is a spin off of Hewlett Packard Corporation (HPQ) that is among those companies that underperformed through most of 2020, falling from a pre-pandemic high at around $16.50 at the end of 2019 to a March low at around $7.40. It mostly hovered within a couple of dollars of that low until November 2020, when the stock started picking up a lot of bullish momentum; in fact, from that starting point a little above $8 in November, the stock rallied to $12 per share by the end of 2020. Since then, the momentum has accelerated even more, pushing the stock to a consolidation range a little above the stock’s pre-pandemic highs, and a little below $17. That consolidation also marks a divergence from the rest of the sector, which has become increasing volatile in the last month or so as questions emerge about the pace of inflation and how sustainable the price gains in so many of this sector’s high-flying stocks really is likely to be. HPE also boasts a solid fundamental profile that is showing useful and important signs of gains along with a still-useful value proposition. Does that make HPE a company you should pay attention to? Let’s check it out.
Fundamental and Value Profile
Hewlett Packard Enterprise Company (HPE) is an edge-to-cloud platform-as-a-service company. The Company’s segments include Compute, High Performance Compute & Mission-Critical Systems (HPC & MCS), Storage, Advisory and Professional Services (A & PS), Intelligent Edge, Financial Services (FS), and Corporate Investments. The Compute portfolio offers both general-purpose servers for multi-workload computing and workload-optimized servers. HPC & MCS portfolio offers workload-optimized servers designed to support specific use cases. FS provides investment solutions, such as leasing, financing, information technology (IT) consumption, and utility programs and asset management services, for customers that facilitate technology deployment models and the acquisition of complete IT solutions, including hardware, software and services from HPE and others. Corporate Investments include Hewlett Packard Labs, which is responsible for research and development. HPE has a current market cap of $21.2 billion.
Earnings and Sales Growth: Over the past year, earnings declined about -13.6%, while sales increased by 11.5%. In the last quarter, earnings strengthened by 11.75%, while sales were -1.95% lower. The company operates with a narrow, but improving margin profile that appears to be emerging from negative status earlier this year; over the last twelve months, Net Income was just 2.35% of Revenues, but increased to 3.87% in the last quarter.
Free Cash Flow: HPE’s Free Cash Flow is healthy, at about $2 billion. On a Free Cash Flow Yield basis, that translates to 9.81%. At the end of the third quarter of 2020, Free Cash Flow was just $560 million, and started 2020 at $1.7 billion. The improvement over the last six months is a good indication of the company’s ability to survive the pandemic and begin to emerge in a stronger position than it was in when it started.
Debt to Equity: HPE has a debt/equity ratio of .74, which is a conservative number. Their balance sheet shows $4.6 billion in cash against $12.3 billion in long-term debt. Their balance sheet indicates their operating profits are adequate to service their debt for now; however if Net Income turns back to a negative pattern in the quarters ahead, the company will be forced to rely primarily on its strong liquidity. It is worth noting that at the end of the first quarter of 2020, cash and liquid assets were about $5.1 billion.
Dividend: HPE pays a dividend of $.48 per share, which translates to an annual yield of about 2.96% at the stock’s current price. I think that it is also noteworthy that the company has not cut or reduced their dividend; in fact it remains a bit above the $.44 per share payout they maintained until the beginning of 2020, when management increased the dividend.
Price/Book Ratio: there are a lot of ways to measure how much a stock should be worth; but I like to worth with a combination of Price/Book and Price/Cash Flow analysis. Together, these measurements provide a long-term target at about $19 per share. That suggests that even with the stock’s increase in the early part of this year, HPE’s stock remains undervalued by about 18%.
Technical Profile
Here’s a look at the stock’s latest technical chart.
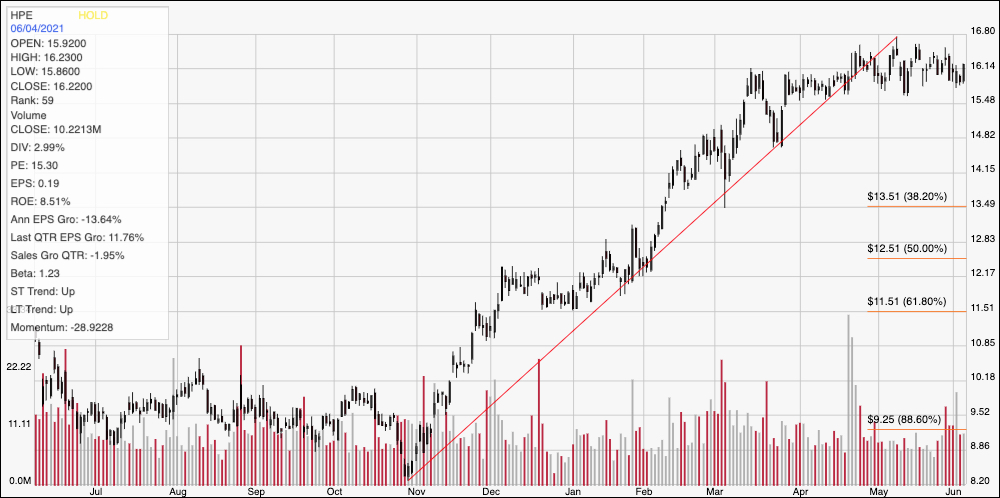
Current Price Action/Trends and Pivots: The chart above traces the last year of price activity for HPE. The red diagonal line traces the stock’s upward trend from a low point in November at around $8 to its peak in early May a little below $17. It also provides the baseline for the Fibonacci retracement lines shown on the right side of the chart. The stock’s increase since November pushed it out of a narrow consolidation range at the bottom of a long-term downward trend, with a strong intermediate-term trend that has settled into a second consolidation range at the top of that trend. Current support is around $16, with immediate resistance at $16.80. A break above resistance at $16.80 should offer near-term upside to around $18.50, based on the distance between the bottom of the stock’s consolidation range, which is around $15.50 and the top of the range a little below $17. A drop below $15.50 should find next support at around $14.50, with secondary support at around $13.50 based on the 38.2% retracement line.
Near-term Keys: The stock’s consolidation at the top of an upward trend is interesting, and if you prefer to focus on short-term trades could be a reason to start looking for a trading signal depending on the direction it moves when the consolidation range is broken. A break above $17 could offer an opportunity to buy the stock or work with call options, using a target at around $18.50 as a functional profit target for a bullish trade. A drop below $15.50 might provide a signal to short the stock or buy put options, with $14.50 to $13.50 acting as a useful near-term target. Despite the trend, I think the best probabilities with HPE actually lie on the long-term, value-based side. This is a company that appears to have weathered the worst that 2020 had to hand out, and that I think is in good position to lead out in a very crowded and competitive industry. With a healthy dividend and a nice value proposition, it could offer a patient investor some good opportunities.